

One Year Later, But an Eternity in the Oil Market
One Year Later, But an Eternity in the Oil Market
An Oil Market Rant: Part 2

Well, it’s been nearly a year since I posted the twitter thread referenced in my first Substack article. To say it’s been a wild ride in the oil market since then would be an vast understatement.

However, it’s that wild ride that certainly keeps me, and I’m sure many others, coming back for more. To discuss all that I have leaned about the O&G market just last year with the shear breadth of micro, macro, geopolitical, and financial events that occurred is a near impossible task. It is perhaps best represented in the handy graphic below I marked up with my journey of discovering how little I know about the O&G market.

I fully acknowledge I’ll likely never reach the top of “grownup mountain”, even with a life time studying the O&G market ahead of me. The vast ocean of O&G market specifics, technical areas of expertise, various cross-market interactions, and the broader energy market in general may be too much for any one person to truly master. That is precisely why I love it so much. There is so much to learn, it’s such a dynamic market, and if you don’t respect when investing you’ll get wiped out before you know what happened. It truly takes a community to even attempt to figure it all out.
So, what follows is an update/expansion on some of my thoughts from Oil Market Rant: Part 1, a recalibration of my investing strategy going forward, a discussion on where we are in the oil market today, and some helpful links to articles that have guided me the past year. To be clear, the bulk of what I will touch on below will be thematic in nature. While I will touch on specific points as they relate to the oil market, I will not be doing a deep dive on the data and do not mean to simplify oil market moves to a singular point. There are plenty of other sources for data, which I will link where appropriate.
The most difficult thing about investing in the oil market the past year for me was, sifting through all the noise to find the right signals. While I think I have a pretty good grasp of the traditional oil market signals, (commercial/SPR/floating inventory, S/D balances, OI, MM positioning, OVX, futures spreads, crack spreads, physical spreads, rig count, frac spread count, crude production, associated gas production, productivity, etc.) it is crucial to be able to recognize broader macro signals as well.
Additionally, the theme of 2022 seemed to be turning historically reliable signals on their heads (ex. Total inventory draws - including SPR). Holding on to some of those old “reliable” signals and not recognizing when the market was pricing in new ones (ex. the impact of rate hikes) could have wiped you out in 2022 (depending on if you were levered up). Plus, is likely to be causing some bleeding so far in 2023 if you continued to rely on leverage/options express part of your positioning as well. While I may not be as ignorant of the factors that led crude to slide from +$100/bbl down below $70/bbl, I am guilty of failing to realize where we were in the macro v. O&G cycle and how that changes risk (causing some bleeding for me in 2023).
From April 2020 to June 2022 the easy money was made in O&G investing. I truly believe the coming years will be defined by the volatility of the energy complex. Just to make it out of this cycle is going to take a lot of studying, patience, conviction and emotional intelligence to position your portfolio appropriately and recognize when its ultimately time to take your chips off the table.
For this very reason, my 2023 word of the year is: Kurtosis. From Investopedia (below):
For me, a better understanding of the increased kurtosis I believe we are seeing in the market provided a logical expansion of the simplified probabilistic price analysis I referenced in part 1 of my oil market rant.
A couple observations I’ve made over the past 12 months relate to how expectations are priced into the market and the harmonics of the market (ie. will signals amplify or cancel each other out). For example, the potential loss of Russian supply in 2022 was immediately priced in for the worst possible outcome (in hindsight, a huge signal to fade the summer rally). By the late summer we saw the impacts of the Fed and other CBs fighting inflation starting to “cancel out” this expected supply loss by moderating demand. But, then the wheels really started to fall off…. What was deconstructive interference turned to constructive, amplifying the $/bbl price move DOWN as supply massively exceeded expectations mainly in form of SPR releases and lack of lost of Russian supply. In terms of the impact of this on my portfolio, quite simply, I was not properly assessing risk of multi sigma moves in price.
So, to better visualize the inherent risk in high volatility/high kurtosis markets vs. a normal distribution with a “mean price band” I created the below. Statistics and Quant PhDs, give me some slack here… This is meant to be more a visually representative guide rather than mathematically 100% accurate.

While I have recalibrated my expectations in terms of average prices down to the $70-$90/bbl range, I also expect larger (multi-sigma) moves in either direction to occur with increased frequency. Pull up the ever growing list of tail risks in the market and I think this is a fair assumption. The impact this has had on my investment strategy is two fold: First, a shift from a more “aggressive” strategy (ex. buying options) to a more “passive” strategy (ex. selling covered options) around core O&G equity holdings. Second, buy more of the companies that have industry leading ROCE at trough prices. This point has been made clearer to me with every passing month the price of crude ticked lower the past year. As am sure many of you are familiar with, Arjun Murti has written extensively on the matter in his Super-Spiked Substack. His latest article is a must read and a great summary of some of the themes he’s covered over the past 12 months.

Now, to further elaborate on where I think we are in the oil market cycle, I’d like to now touch on a few themes that I believe will carry a significate amount of weight in terms of the direction of crude prices going forward. However, as discussed above, I view these impacts with the caveat of market harmonics and kurtosis. There are absolutely unknown variables that will be constructive or destructive to the below.
First, the main broad factor driving the markets that everyone seems to be waiting on… when will we have a recession?

Warren Pies is a must follow in this regard and is quite generous with the content/model projections he shares through 3Fourteen Research on Twitter. Based on the recent shock in housing starts data (which showed growth vs. an expected contraction), he argues housing is critical in recession timing and a contraction in payrolls must occur soon to line up with their Q1 '24 recession projection. Of note, Q1 ‘24 recession is already further out than many are predicting.
Yet, while the timing of the recession (if one occurs) may be moving out, the market appears to be fully pricing in a recession within the energy complex now. Ultimately this has led to an equities sector rotation out of energy and a pile into tech (thanks AI bubble) the likes of what may only be rivaled by the exact opposite rotation observed in ‘21 to mid ‘22…

Second, Permian productivity has peaked. With US shale representing the vast majority of crude/liquids supply growth the past decade, the peak of its most prolific play is sure to have a major impact on S/D balances going forward. Please see the below except from Goehring & Rozencwajg’s Q1 2023 Natural Resource Market Commentary for more details.

The timing of this research piece by GoRozen and recent trends in rig count and frac spreads across the lower 48 states I find extremely interesting considering the recent downward adjustments in Q4 ‘23 and ‘24 crude price projections from the major investment banks. Goldman Sachs for instance estimates Q4 US crude production will come in at 12.83Mbpd. While the downward revisions were made due to the abundance of supply noted in the market, the call seems to come at the exact time when supply/projections of supply are making a turn in the other direction. If current US shale frac spreads and rig counts don’t inflect higher, almost immediately at this point, those supply projection will not be met. Currently, the trajectory of frac spreads/completions of has us looking at an exit of closer to 12.5Mbpd according to Primary Vision. Extrapolate that miss in US crude to US NGL production, then on US total liquids balance alone that’s quite a supply gap that opens up in GS assumptions it uses to project forward prices.
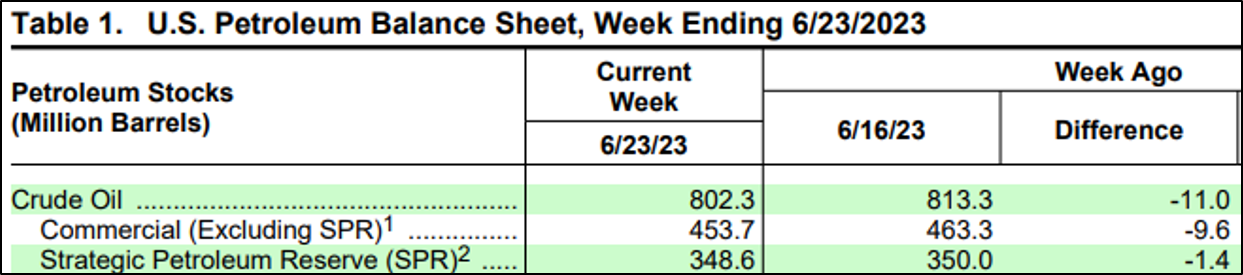
Further exacerbating the change in supply availability headed into H2 is the elephant in the room, the OPEC+ cuts. However, due to the October 2022 OPEC cuts that were not actually cuts but a re-baselining of quotas, I believe OPEC is now suffering a crisis of confidence from the markets. The market is clearly in a “Show Me” mode. Fortunately, as of todays EIA WPSR the May (real) cuts are finally starting to be seen.
HFI Research covers the groups crude exports extensively through the use of high frequency data services and their own exhaustive research- in short, OPEC+ is delivering on its promises.

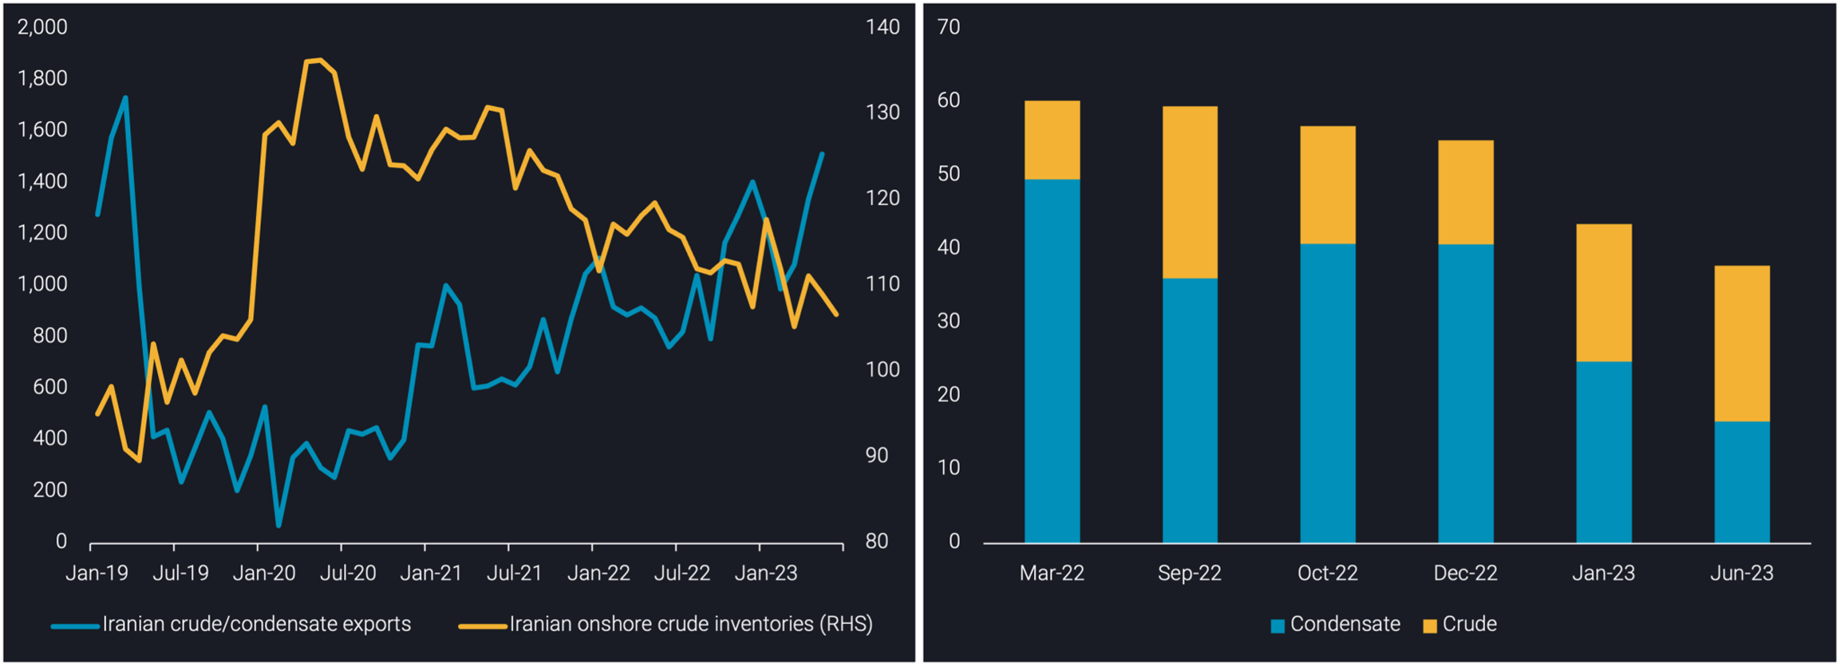
Looking back at the past 6 months, I don’t think Goldman is wrong at all in their call for lower upside in oil prices on elevated supply. It surprised many market participants in either how it was priced into the market (ie. the SPR release being priced in as additional supply to commercial inventories, not a reduction to total inventories) or how it showed up in the market (ie. Iran upping production and dumping its onshore/floating inventories on the market).

Additionally, Goldman makes many good points surrounding interest rates hikes, “destocking” as a result, and the spreads between crude grades.
The increasing divergence in crude grade timespreads provides and interesting reflection on the state of the global market, granted OPEC cuts are having some of an impact here. On one side, the service sector is generally strong and driving up demand for middle distillates (gasoline, diesel, jet fuel) which are already below average inventory levels in certain pockets of the world. Meanwhile, the manufacturing/goods sectors are seen to be struggling globally. Petrochemical demand, typically an economic bellwether (plastic is in everything), has been anemic with naphtha cracks showing little signs of strength in Asia. In the US, shale has created a glut of NGLs that no one wants, so it gets blended into the crude. This all leads to lowering demand for the lightest barrels of crude with higher yield of light end products (Naphtha/NGLs) and increasing the demand for medium crude with higher yields of gasoline, diesel, and jet fuel.
With regards to the Fed hiking interest rates at the fastest rate in decades, this has naturally led to recessionary fears and caused market participants to adjust their risk models/positioning. In the oil market, the cost of carry for physical inventory and the risk free rate for holding paper positions in a high interest rate environment as led to a massive de-grossing of inventory/net-positioning over the past 6 months.
The main question is, when do some of these variables start to slow/begin to turn the other direction. Rate of change as a way of quickly flipping market flows/momentum. While we are starting to get a clearer signal the supply dynamic is beginning to turn, the demand side of the equation and recession timing is still fairly fuzzy. The culmination of the above (and many other factors) has led to a fairly extreme short positioning by managed money. This, in the context of a lower open interest/liquidity environment, ultimately could result an inflection in crude prices to much higher levels and a rapid unwinding of short positioning (short squeeze). Naturally, O&G equites would benefit from this scenario as well.

So….. What’s next?
In an increasingly bifurcated world of east vs. west monetary/fiscal/geopolitical policy, obscured crude flows with a large amount of “sanctioned” barrels, and services (strength) vs. manufacturing (weakness) this is an exceedingly hard call.
If it wasn’t already clear, I’m certainly bullish crude price from current levels as OPEC/KSA cuts begin impacting onshore inventories and seasonally we enter a strong period for demand. But, given the current environment of the O&G market and broader market in general, breaking out the crystal ball really isn’t the point of this article.
What I’m encourage at this point is to take a step back, and take a deep breath. I generally try to keep a longer term perspective, with a pulse on the short term. But, recently it seems to have become too easy to get caught up in the day-to-day/ distinguish between signal and noise in a world of somewhat dilapidated data quality. (See EIA WPSR Adjustment & the growing shadow fleet of VLCCs around the world) So, now is the time to reflect on the past year as we head into the next phase of this O&G market cycle and reassess your risk tolerance given a higher kurtosis environment. Can you stomach the inherent volatility of the energy cycle overlaid with a secularly inflationary backdrop in a increasingly bifurcated world? If you can, don’t let the cycles within the broader secular oil market trend discourage you (or convince you to lever up and max our your margin availability for that matter). Let ROCE, capital efficiency, and reserve length be your guide to the companies that will be able to successfully navigate this type of market. The best strategy may be to just sit on your hands with those companies in your portfolio for 8 - 10 years, then sail off into the sunset as this energy cycle inevitably ends. I’ll be here, doing what I love, continuing to pour over every detail of the O&G market I can get my hands on. But one day, hopefully, I’ll see you on the beach.
Cheers!
*I am not a financial advisor and the above article should not be taken as investment advice. As always, DYODD
RySci’s Hot Sauce of the Week - Hot Ones. The Last Dab. Apollo Hot Sauce
