
Fundamentals Matter... But Not Today
Refining the Process - An Oil Market Update

Oh, the joys of another rapid rise in oil prices after a precipitous fall from a peak just 6 months ago. At this point, I’m almost numb to it. And maybe that’s a good thing. It’s allowed me to clear my head a little. Drill down and examine what I might be missing in the timing of my trades. While I’m generally confident in my understanding of the O&G market fundamentals from week to week and spent a large portion of the past 18 months brushing up on the macro side, the selloff at the end of Sept ‘23 gave me a sense there was something in the trading mechanics of it all that I had overlooked. In this post, we will explore what I’ve learned over the past 6 months as we rapidly ascend our first bullish ramp in oil prices for 2024.
I give immense credit to Dr. Ilia Bouchouev in this regard, who has pierced the veil of oil quantitative/algorithmic trading with his book Virtual Barrels - Quantitative Trading in the Oil Market
So, diving in, we’ll start with what I’m watching on the macro and fundamental side. This will be a story told mostly in charts so we can get to the meat of this article. Keeping this section “short” serves another purpose as well. I always wanted to believe fundamentals were the key to gaining an edge in O&G trading. This is wrong. They are a key component in more secular trend projections. But, the shorter-term cycles of the market will rip you to shreds if you are overly reliant on them in attempting to time the market. A simplified demonstration of this can be seen in the global inventories since the start of the year.
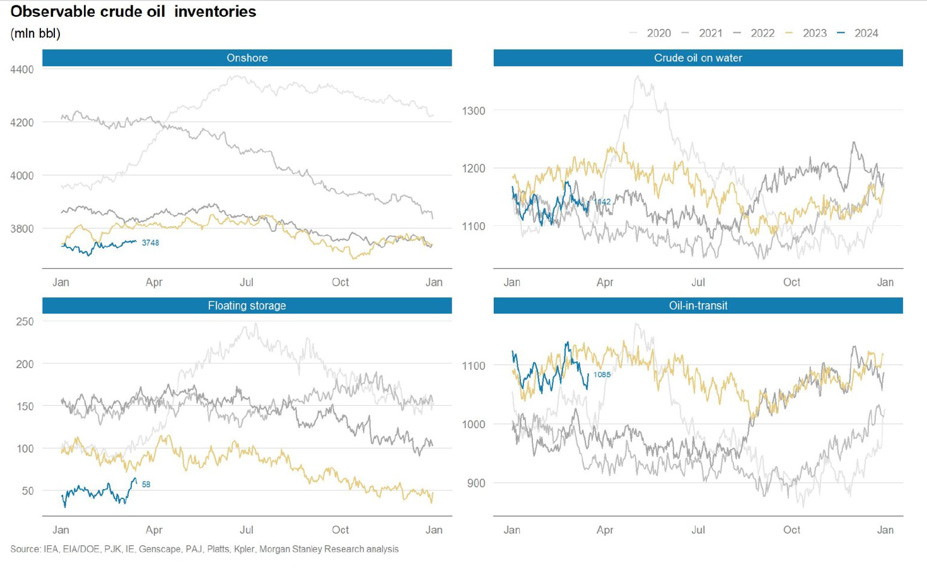
To start, 2024 global crude inventories were drawing at times well over 1 Mbpd, with a significant portion of the draws occurring in China. This was the exact opposite of consensus projected inventory builds due to supply and demand factors for Q1. Yet, the price hardly budged from the low $70/bbl range (WTI) in the first 5 weeks of the year outside of a brief whipsaw of geopolitical headlines in late Jan.
Hence, fundamentals matter… but not today. The timing is what’s important here, and several technical and structural signals had to inflect before the rally could commence. I began to clue in on this in early Feb, given the inventory draws and the underlying changes in crude futures that had occurred (more on this later).
To give you a sense of how significant the inventory draws to start the year and the flat to small builds for crude in March were to shifting market sentiment back out of the chasm of bearishness in December 2023, consider the following.
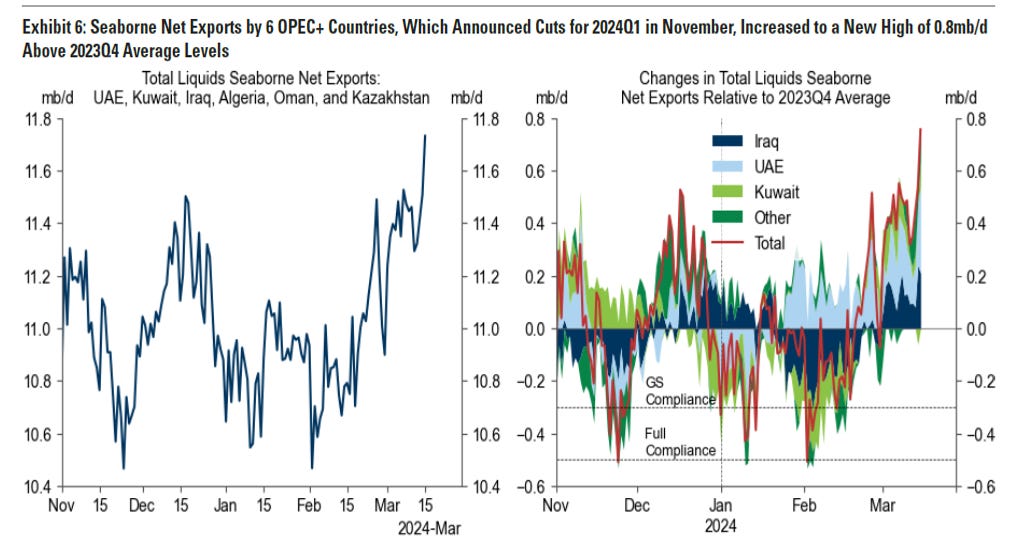
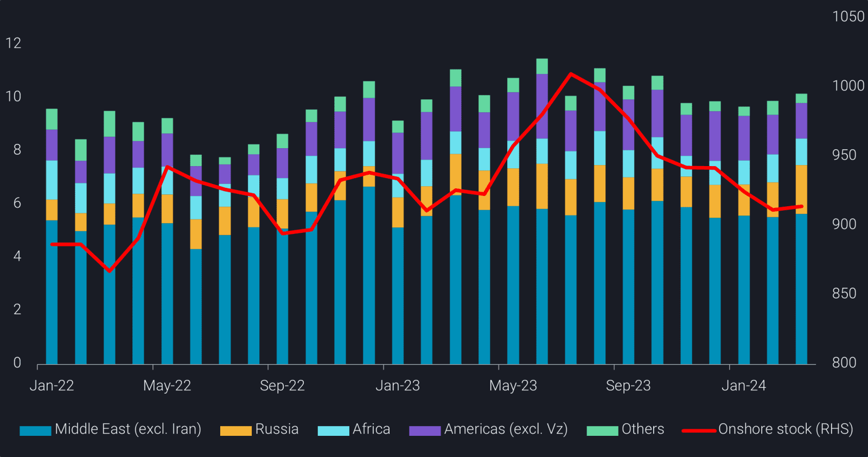
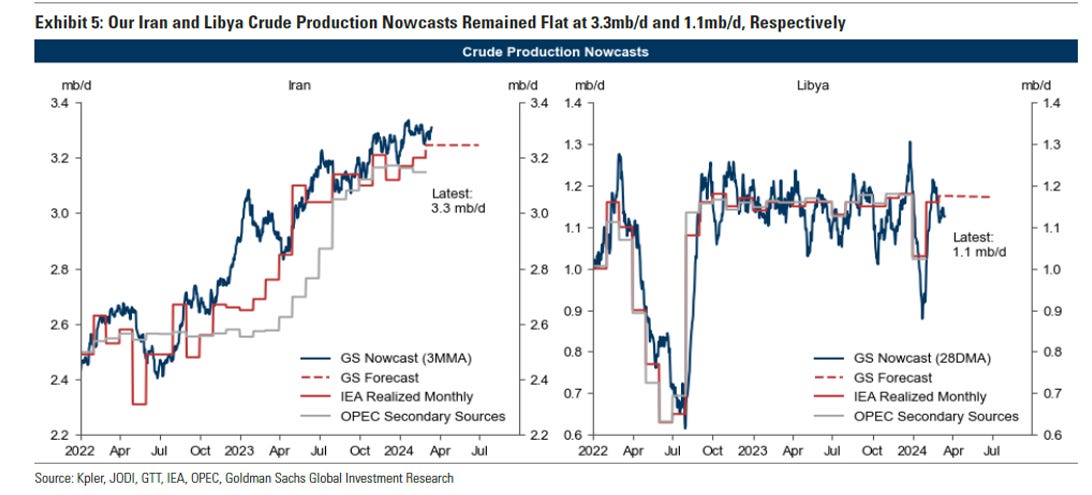
OPEC+ exports, outside of KSA, have averaged much higher than what would be expected under full compliance based on guided cuts (above). All the while, Iran has been rapidly increasing production and a normally volatile Libya has been consistently above 1Mbpd (below).
Additionally, US production regained its precovid peak in Q4 (below). This was part of the oversupply story in Q4 of 2023 with a “surge” of US crude and NGLs coming to the market in H2 of 2023.
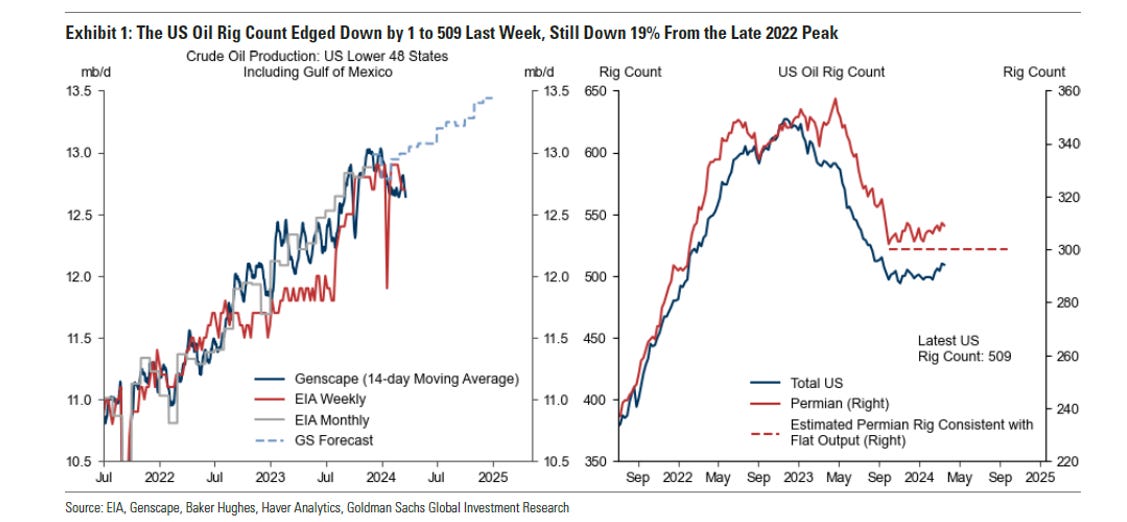
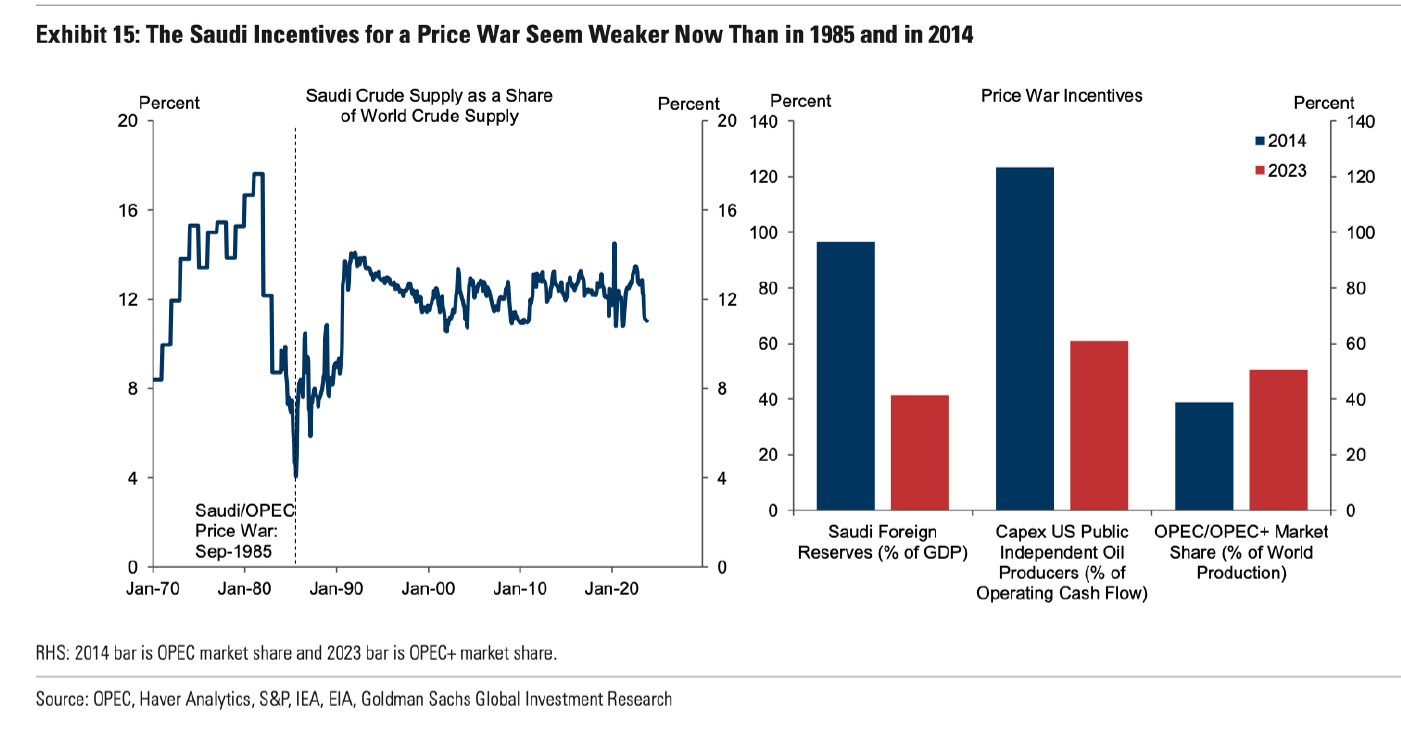
However, this dynamic is rapidly shifting from US production beats to misses as growth decelerates. Looking at rig counts (below) we’ve finally entered the 9-12 month lag window mentioned in my last article where the declines are starting to be seen in the production figures (Genscape real-time production based on pipeline data above). If current trends hold, this would significantly impact the US production projections and therefore world S/D balance for the year and on a go-forward basis. This is likely playing a major part in KSA's thinking around OPEC cuts and when to return barrels to the market. For what it’s worth, I never really bought into the idea that KSA would consider ending cuts early or initiate a price war given their market share was well within the range of the past couple of decades (below), and suspect they had a firm grasp of the current dynamic playing out in US production.
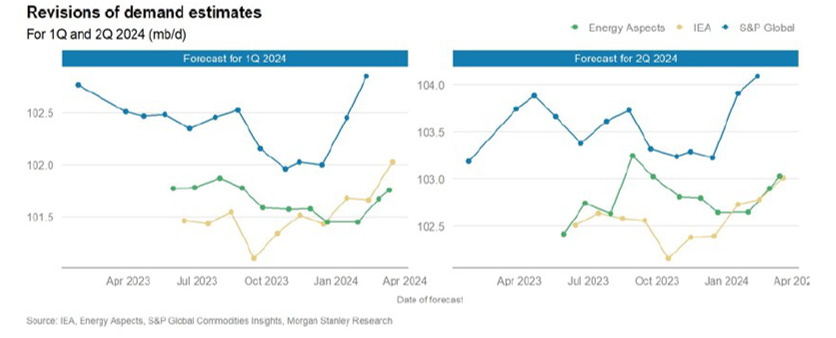
Given the pace of crude inventory draws to start the year and the relatively benign builds in March (despite being in the depth of refinery maintenance season and a surge of OPEC exports hitting the market), you might suspect global oil demand has been significantly underestimated. Not a bad suspicion, given the significant upward revisions to demand by every single research group, bank, and government agency (below).
Okay, we’ve touched on some of the fundamental drivers of the market with inventories, production, and consumer demand. What about the physical side signals for those buying and processing the crude?
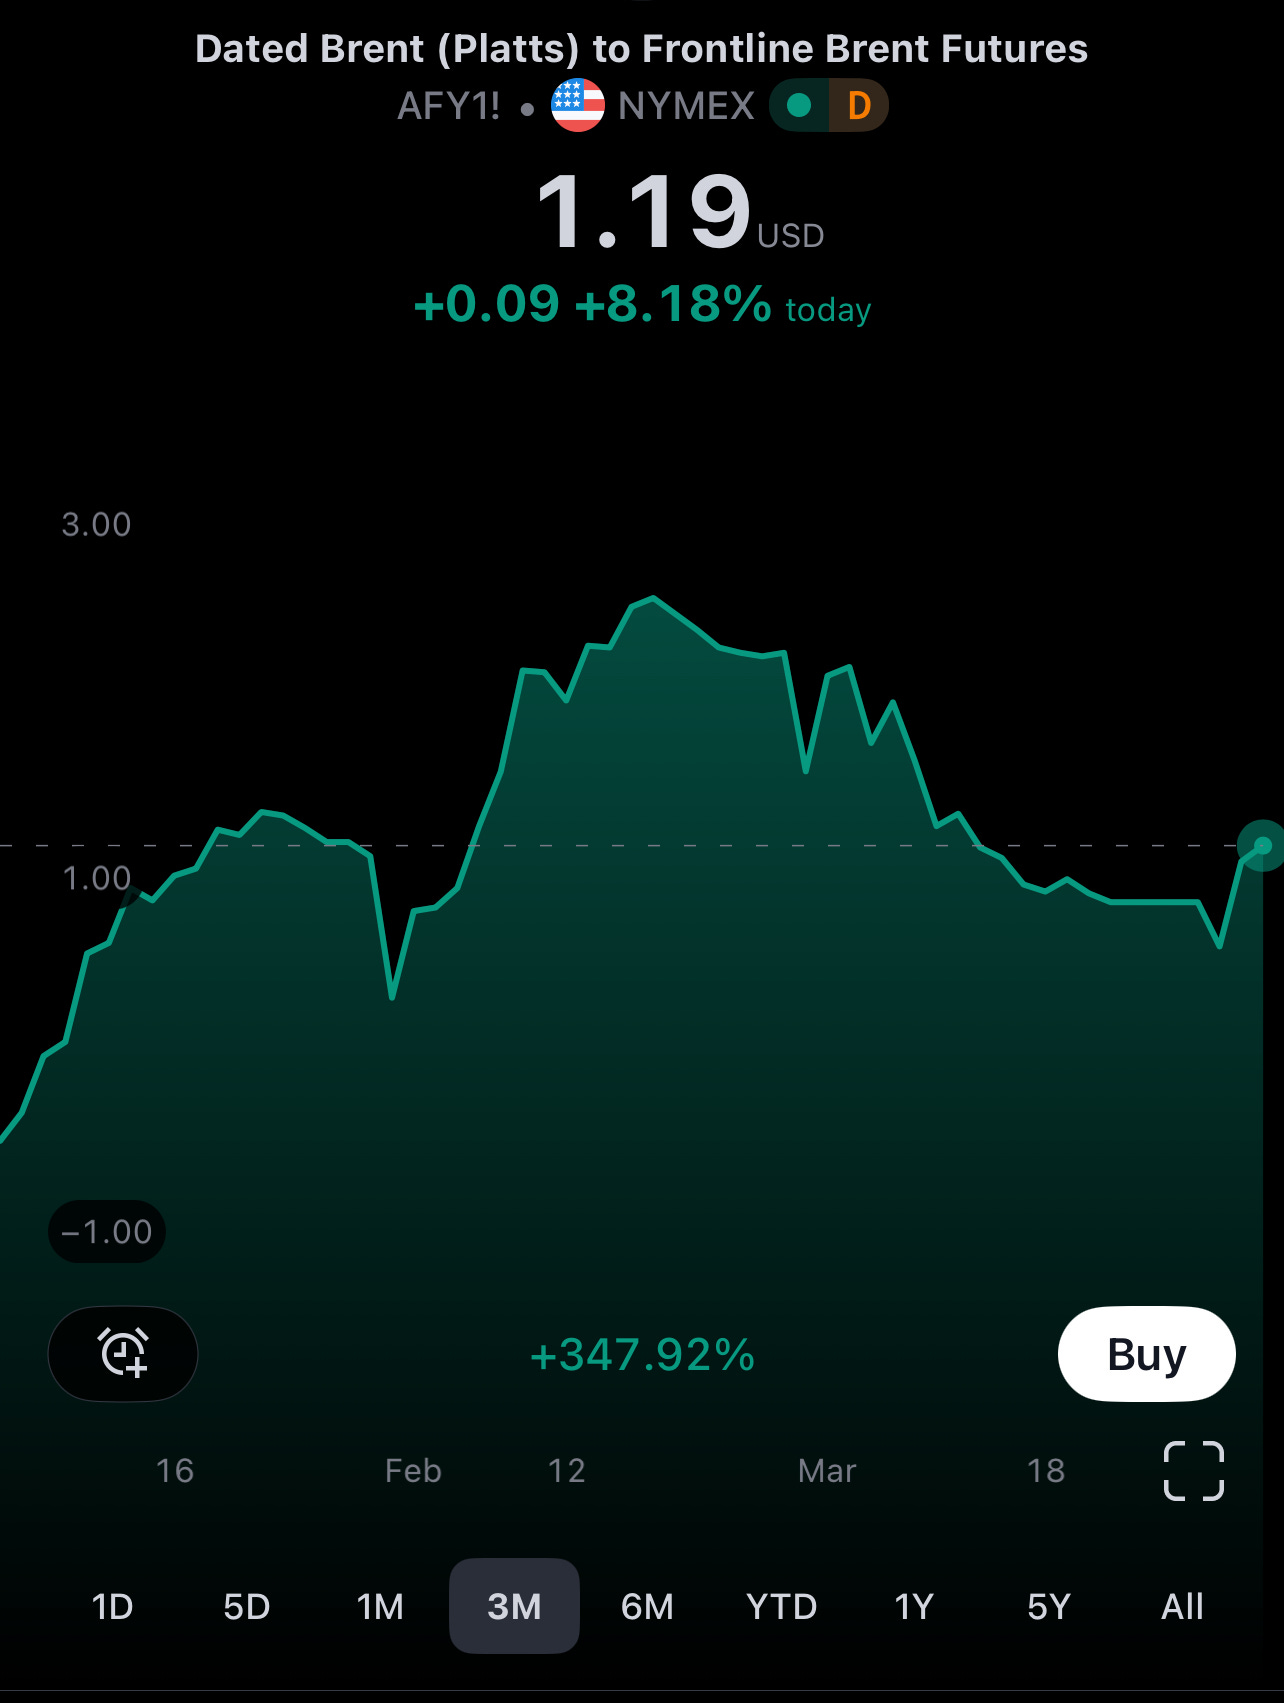
Overall, the physical indicators look fairly positive. Brent CFDs have strengthened significantly since the start of the year, when they were in contango. The recent weakness off the February peak is likely attributed to the ramp in global refinery maintenance.
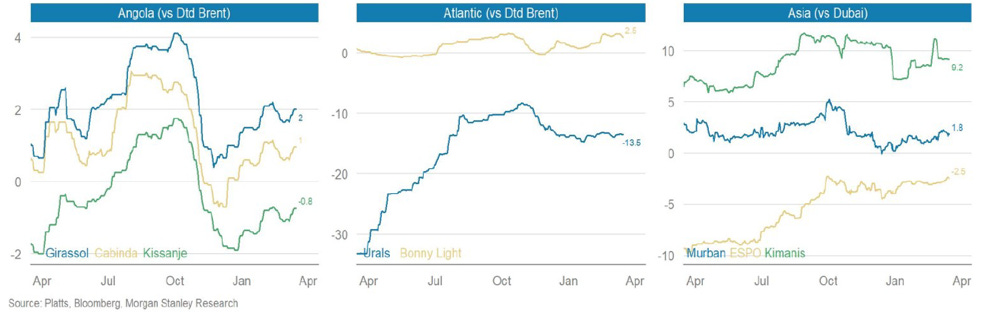
Various crude grade spreads have all pushed higher over the last few months as well (below).
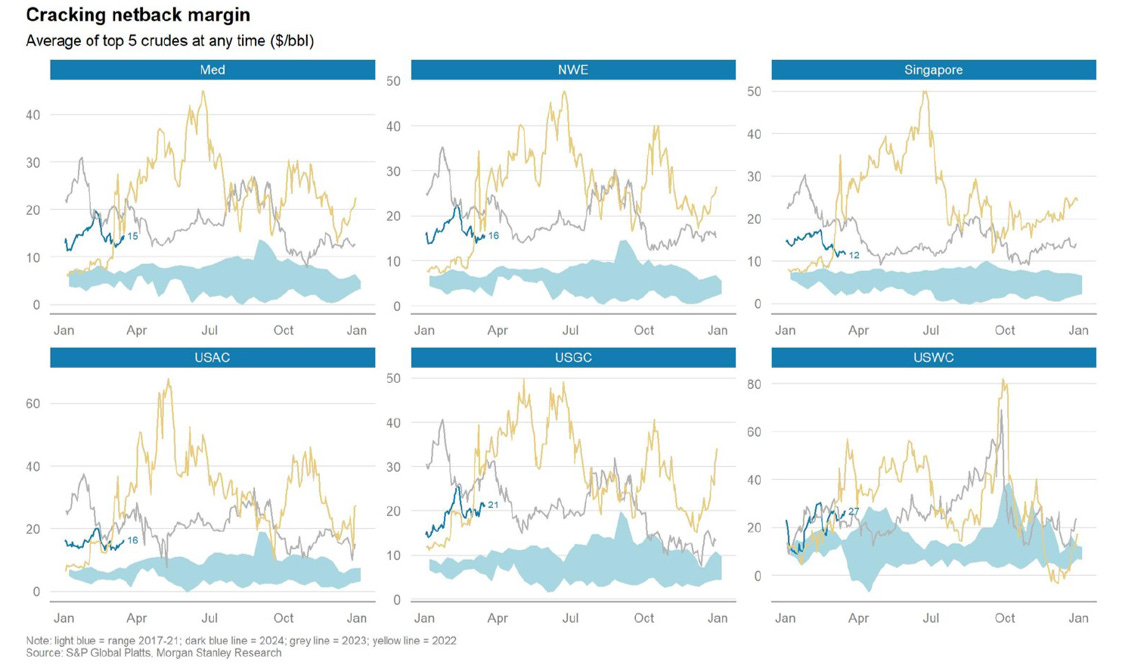
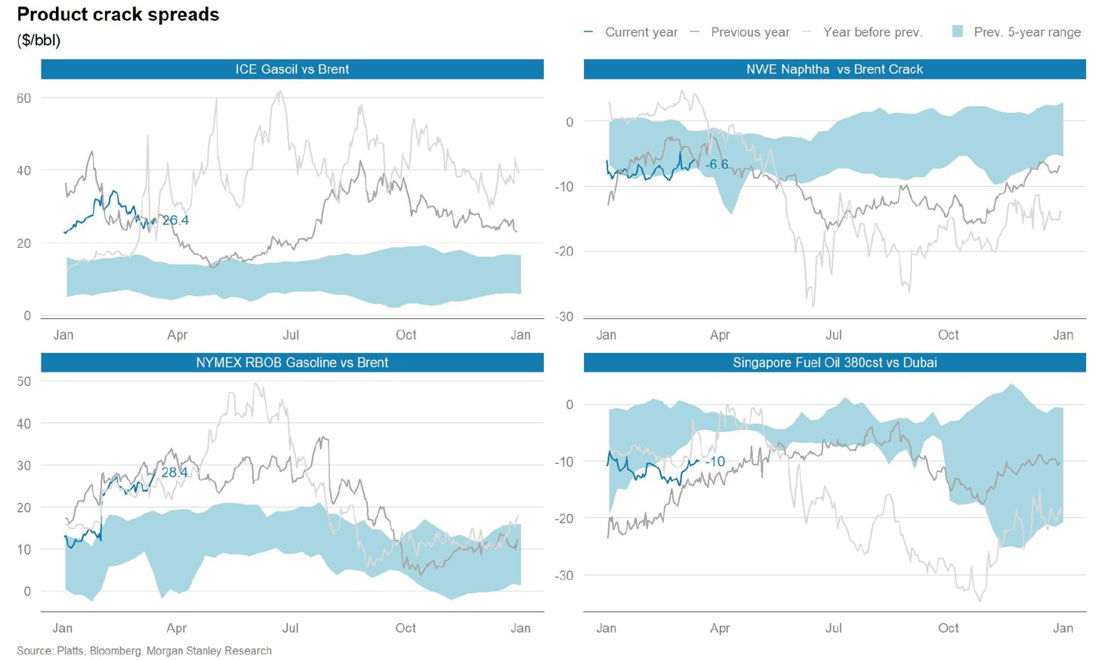
Refinery margins and product crack spreads have come off their near-term bottoms in December and remain constructive of the positive demand scenario this year. However, looking at Singapore cracking margins and fuel oil spreads, there are some recent pockets of weakness in the East worth monitoring.
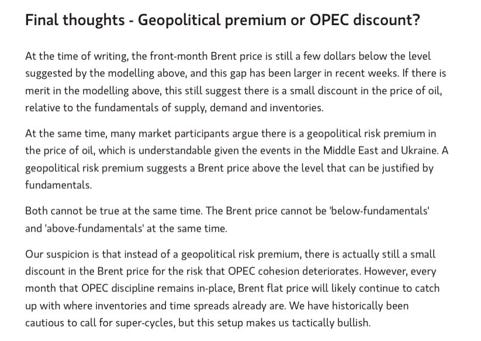
On the geopolitical front, I think Morgan Stanley nailed the crude price impact in their observations from a note earlier in March (below). They argued that there was no geopolitical premium in crude and, in fact, suspected an OPEC quota cohesion DISCOUNT in the price of crude. Drone strikes on Russian refineries, recent OPEC+ cut extensions and commitments to “catch up”, and Iran/Israel tensions appear to have rapidly swung us the other way back toward premium the past two weeks. This recent geopolitical premium injection is likely exacerbating the mechanical move of the paper-fueled rally in flat prices driven by speculators.
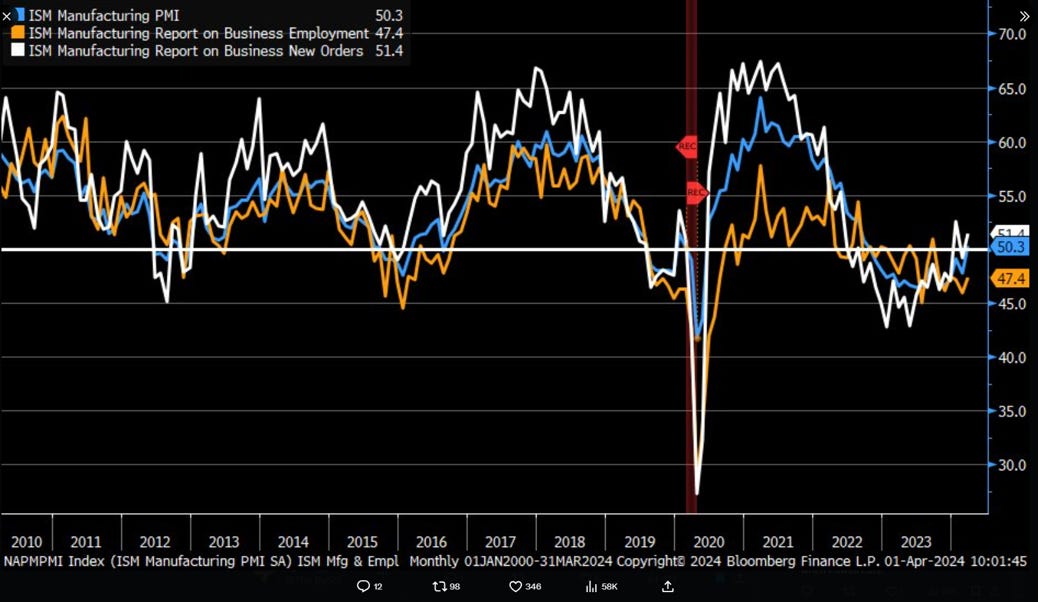
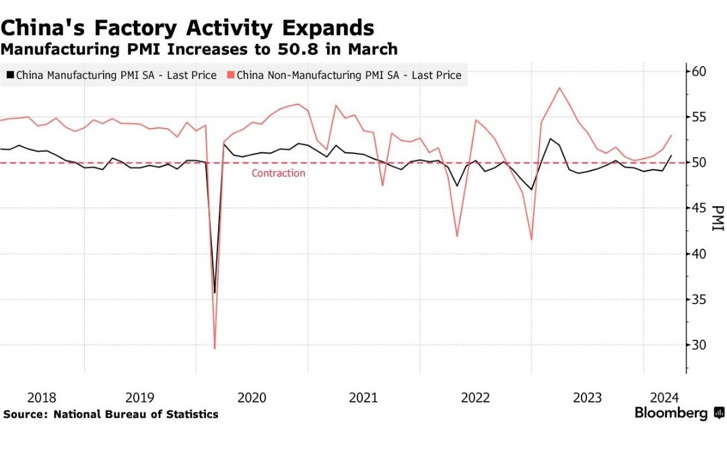
Moving on to a quick note on the macro part of the equation. Considering the manufacturing sectors globally were essentially in a recession last year while oil demand was so resilient I believe is underappreciated. New orders continuing to turn higher and entering expansion territory (+50) post the 2023 inventory work down is key. PMI signals being out of sync with consumer spending last year I believe created false signals of impending economic doom. The reality is that consumer spending and US fiscal dominance outweighed the impacts of the cyclical downturn in manufacturing. Now it appears that manufacturing has finally made the turn in both the US and China, providing a tailwind for demand into H2 and will likely counteract any softening in consumer spending this year.
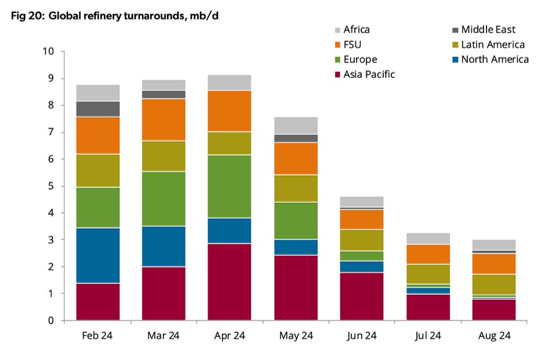
Based on the above everything looks pretty good, right? The economy is fine and inflecting higher with PMIs on the uptrend, oil demand is great, it’s just some transitory refinery maintenance to get past (below). Once the physical demand for these barrels is brought back online the upside is unlimited… and the market is likely already reading through any softness for Apil and May. Let crude price rip to +$100/bbl… what could go wrong?
Well, to answer that, let’s revisit my last article in the run-up to the late Sept ‘23 high, where I identified what I thought was a good target price and completely whiffed on the trade execution due to timing. The setup is remarkably similar now….
Published 9/12/23 - Houston, We Have Liftoff!
With the technical signal in place, the coming onshore inventory draws over the next several weeks should provide the fundamental basis for crude prices to move higher with money managers exiting their short positions helping the move gain momentum. However, I would hesitate to call for a +2 Std move as we will likely see some form of Chinese inventory usage (commercial/SPR) to combat prices rising higher than ~$90-$95/bbl WTI. At the same time, it seems unlikely we would get a knee jerk unwinding of any OPEC cuts (voluntary or mandated) as the group/KSA would likely take a wait and see approach with current marco economic uncertainty. This may allow for a window of stabilization in oil prices at a higher level as KSA is likely looking to over tighten and month ahead production guidance will already be set. All this sets up what could be a big move in energy equities as well. With equity flows of the past year looking like the below, I see significant upside for O&G stock over the next few months as fund flows start to adjust based on the new energy sector momentum as crude prices head higher…..
……The scenario of prices ripping higher would set up a preferential hedge/trade in buying USO puts/put spreads if the near month futures continue their assent without long-dated participation (similar to last year). Additionally, the impacts of Rho on option prices helps this trade by making puts cheaper on a relative basis due to the current interest rate environment.
I will be keeping a close eye on the long dated futures as a signal crude prices may be running away or to confirm this rally has staying power.
How could I have possibly missed this trade… it was right there….
Well, I was looking at the wrong indicators for a reliable short-term signal (long-dated futures) plus, I had quite a big gap in my knowledge of CTAs and the mechanics of how speculative market participants move in and out of the market. The below attempts to start to fill that gap.
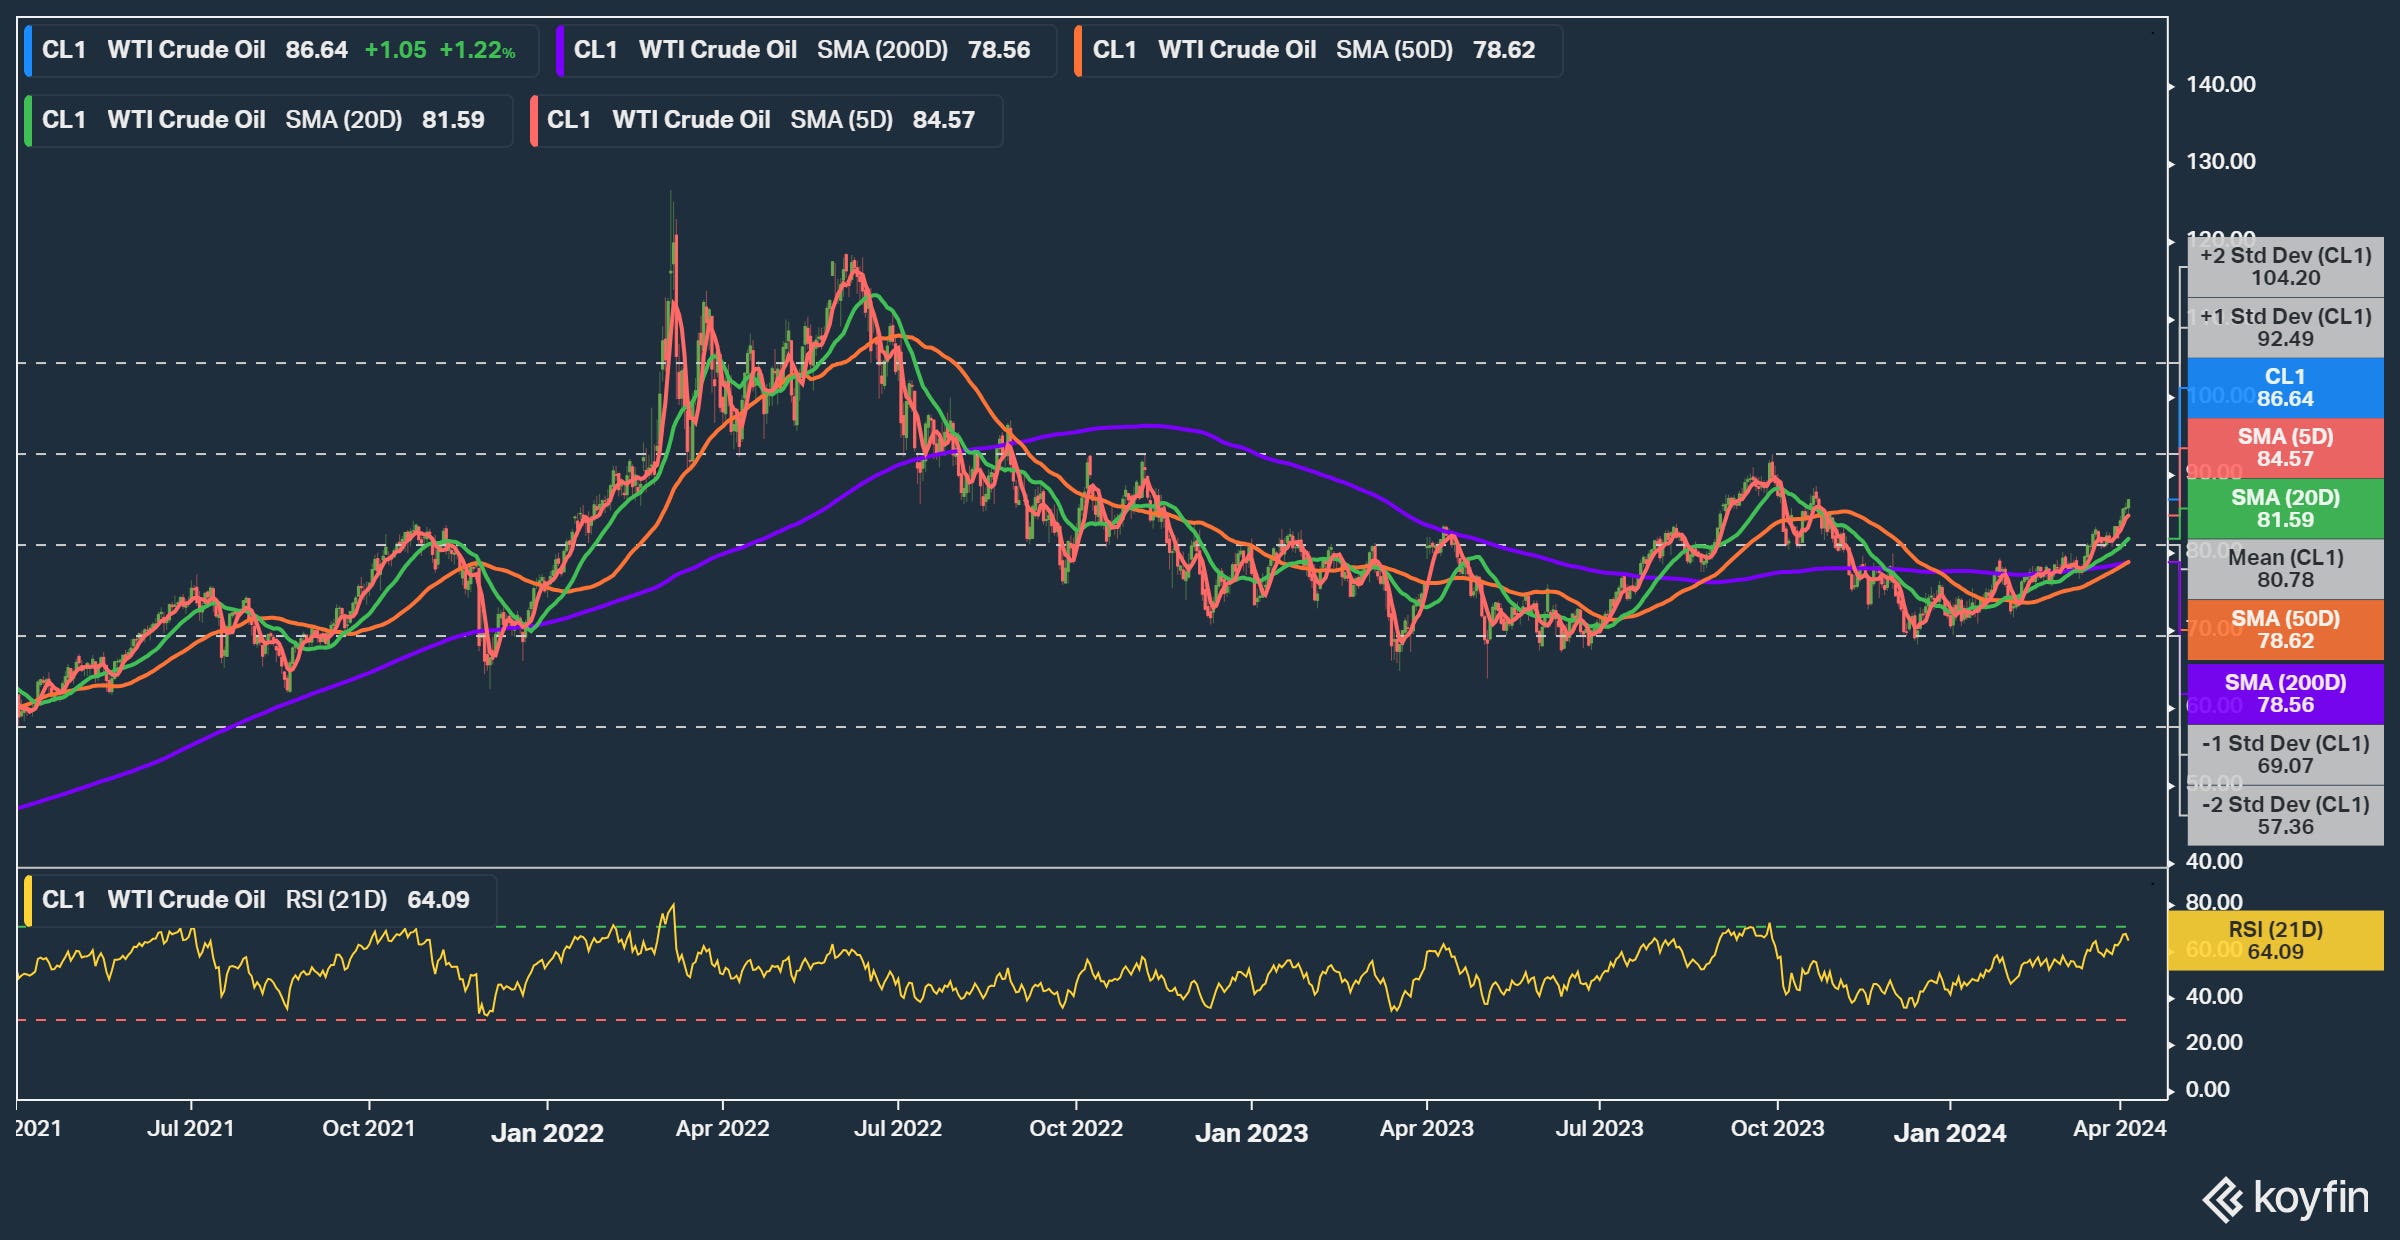
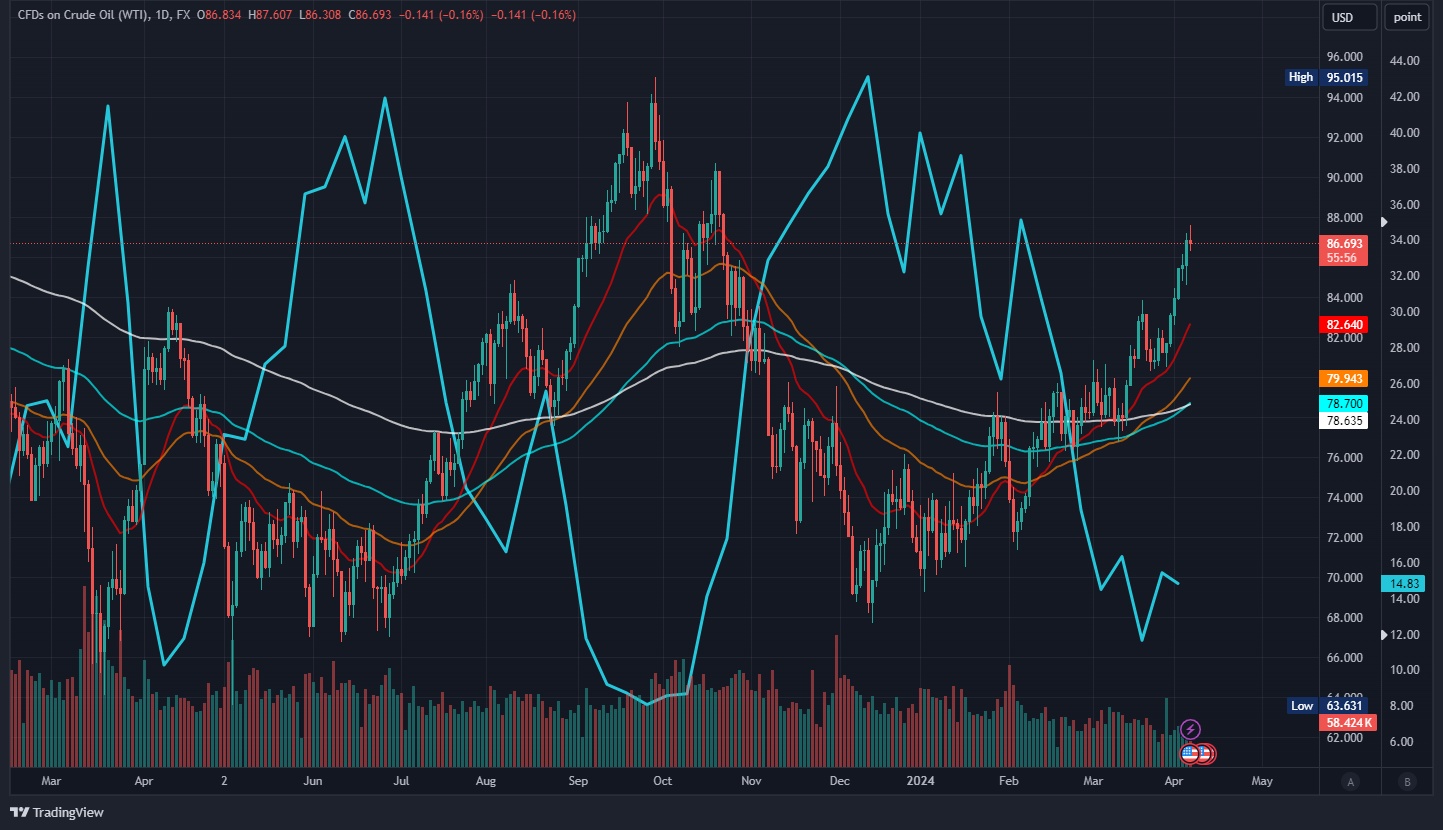
Starting with a silver lining. From a technical perspective, my observations of flat prices and momentum provided one good signal. And, similar to last year, we’ve seen a firm retake of the 3-year mean. This has shifted my probability higher of a move to the current +1 Std dev price of $92.53 WTI before the summer with the projected crude draws and firm fundamentals into Q3 ‘24. The 50d SMA has crossed above the 200d SMA, providing a powerful technical signal to speculators on the direction of the market as well. But, what I needed was a better understanding of what was driving flat prices higher or lower outside of perceived fundament factors and a systematic signal with more inputs.
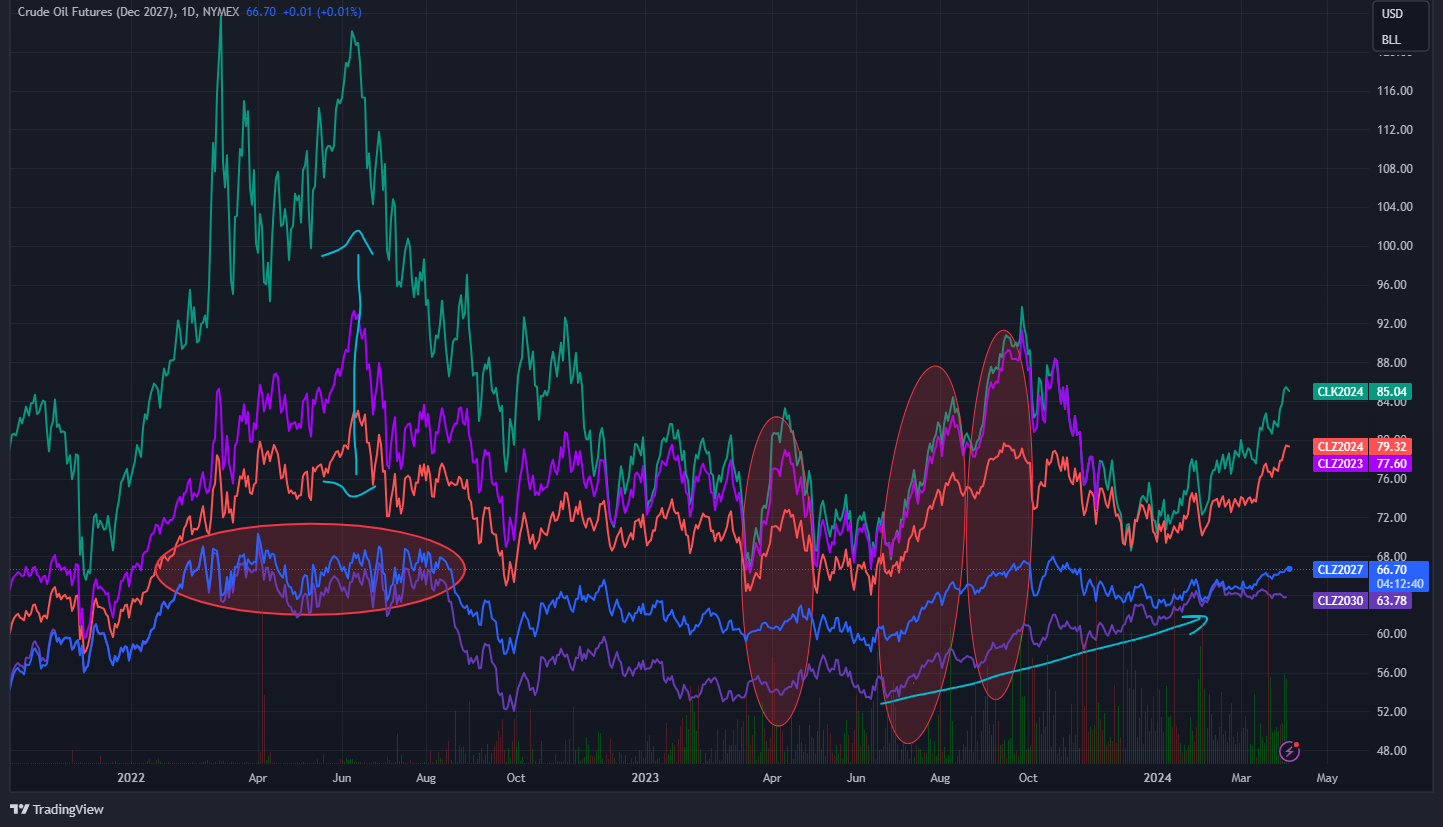
Continuing with a bad signal. My overreliance on the below graph and long-dated futures as an indicator of a potential short-term top was misplaced. While I still believe this is a great way to monitor the overall secular trend of the oil market and can show periods of price disconnects between near-term and longer-dated futures. I do not believe this is nearly as valuable in attempting to time the market in the short term as the other signals below.
Next, while I have kept a close eye on COT reported positioning in the past, my approach of looking across WTI and Brent ended up being misguided. Additionally, while looking at WTI positioning of managed money (MM), I over-emphasised the low levels of long positioning against historical levels vs paying attention to the relative positioning of Longs/Shorts.
See below from Giovanni Staunovo (data through 3/26 shown) with Brent short positioning remaining at a historically substantial level. I can only theorize this large positioning of shorts represents some macroeconomic hedge from risk parity funds that started in size as we entered 2023, what was supposed to be a recession year. The question is, with the economy relatively stable and oil prices + inflation potentially bottoming, does this trigger Brent short positioning covering?
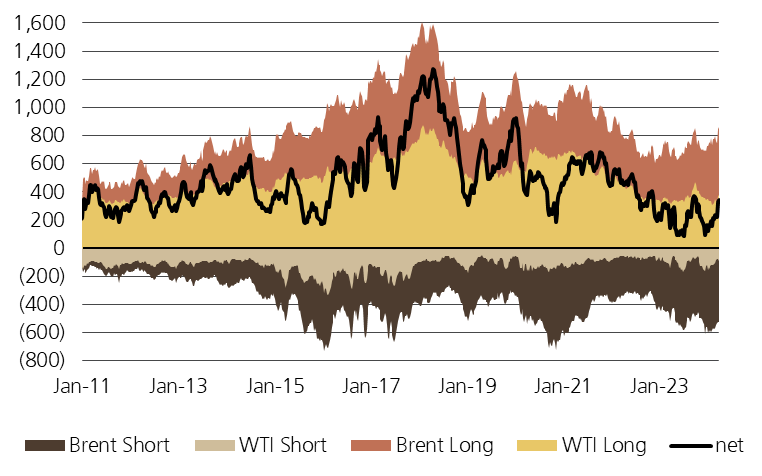
What is clear to me now is that until we see a change in the behavior of Brent noncommercial short positioning then under the current regime relative WTI MM positioning of Longs vs. Shorts provides a much clearer signal on when to start fading the CTAs.
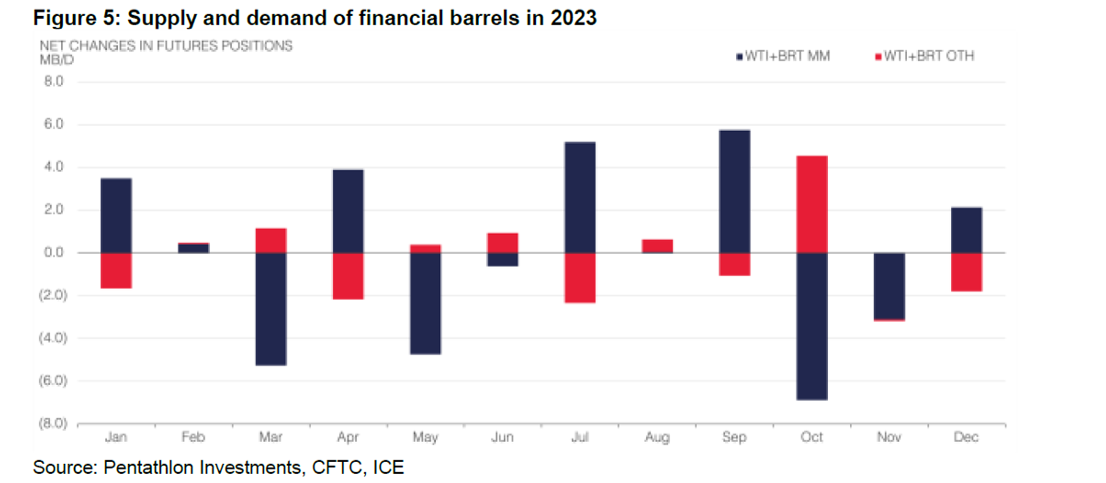
The reason to fade the CTAs at the extremes of relative positioning is apparent as the peaks and valleys of net positioning mark generally mark highs/lows of the market and a followed by sharp price moves. As Dr. Ilia illustrates below the speculative selling or buying by Managed Money (MM) can totally overwhelm any physical tightness or weakness, as well as, other noncommercial speculative participants (OTH). This is precisely what happened in Oct ‘23 as algorithmic selling triggered ~7Mbpd of financial selling that simply overwhelmed a physical OPEC cut of 1-2Mbpd. The move to the downside was likely accelerated by the uneasiness of the bond market at the time before Yellen stepped in with a shift in treasure issuance.
So, how am I thinking about this next peak in crude price after missing the last one so narrowly? This is where I’ve attempted to create a systematic trading signal for crude by combining/monitoring multiple indicators and a reaction function. The below is based on the framework discussed by Dr. Ilia Bouchouev with The Oxford Institute for Energy Studies in his recent article Energy Quantamentals: Myths and Realities about Algorithmic Oil Traders.
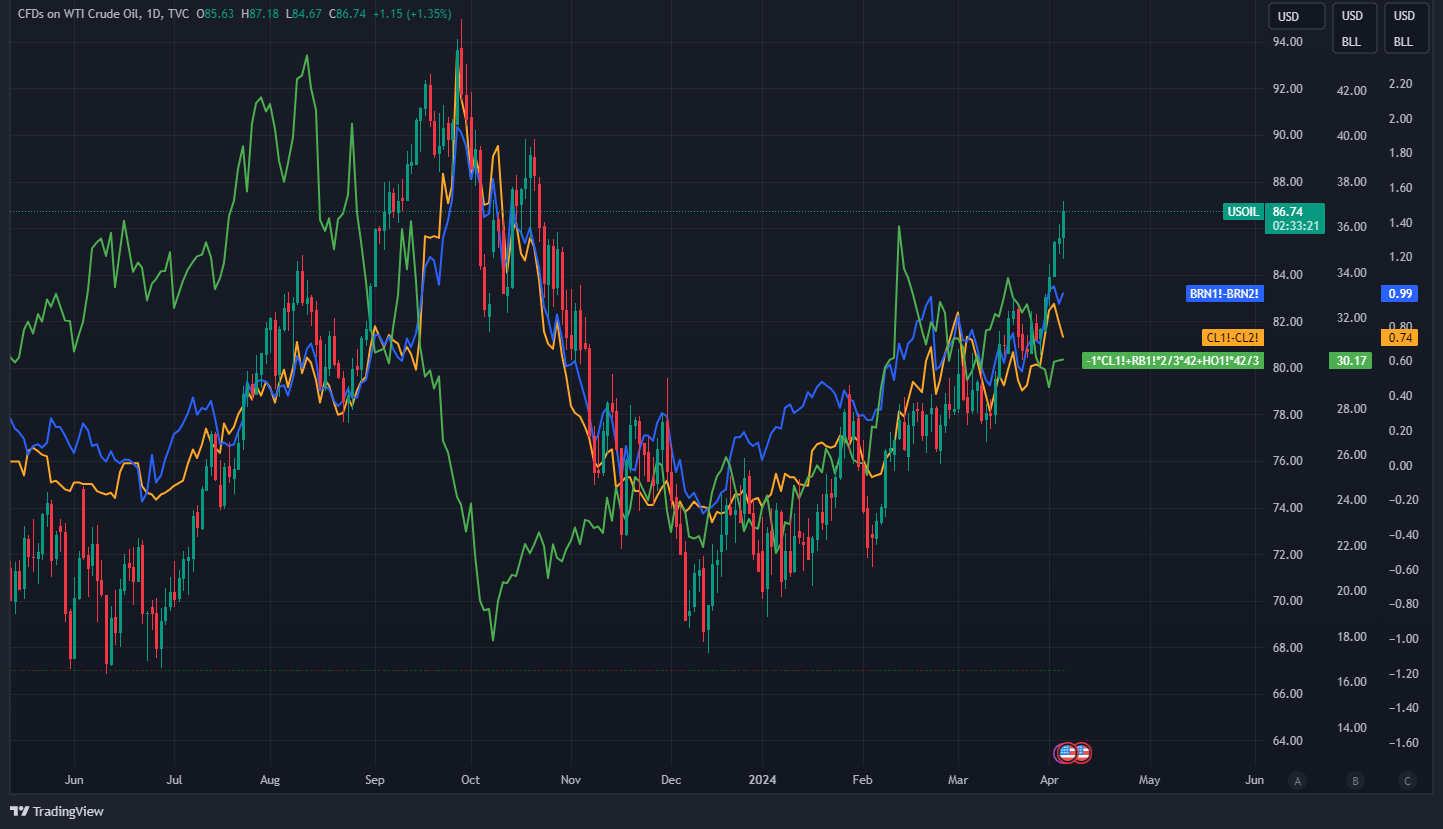
First, I’ve constructed a trend of WTI flat price (candles), 3-2-1 crack spread (green), and Brent (blue) & WTI (yellow) continuous futures prompt spreads. This provides a signal of the strength of the crude price move. Futures prompt spreads give an indication of the physical side of the market and crack spreads signal strength or weakness in consumer demand. I’m looking for crude prices, futures spreads, and crack spreads to be trending together as confirmation of the direction of the market. As an example, in Aug-Sept of 2023, the steep pullback of crack spreads against rising crude prices was a good signal the run-up in crude prices was nearing exhaustion.
Currently, with crack spreads holding above $30/bbl and prompt spreads moving higher, I view this as a positive signal supportive of crude prices moving higher for a least the next few weeks.
As stated above, I view WTI MM (managed money) positioning as providing a much clearer signal on when to “fade the CTAs”. The chart below shows the percent short positioning (blue) of NYMEX MM positioning in WTI against the continuous futures price with moving average trends to again track price momentum.
Big hat tip to Warren Pies + 3Fourteen Research and their work on oil futures positioning which was the basis of constructing the below chart to track this.
Currently, percent short positioning is low but, I am generally looking for a sustained ~10% over a couple of weeks as a signal the price peak is likely near based on the previous peak/trough signal of the past 18 months. That being said this data is reported on a lag with the current available data only up through 4/2 meaning % short positioning likely slid further as crude prices ran up the past few days. On the other end of the trade, percent short positioning above 38% would provide a signal the crude price is likely at a near-term low.
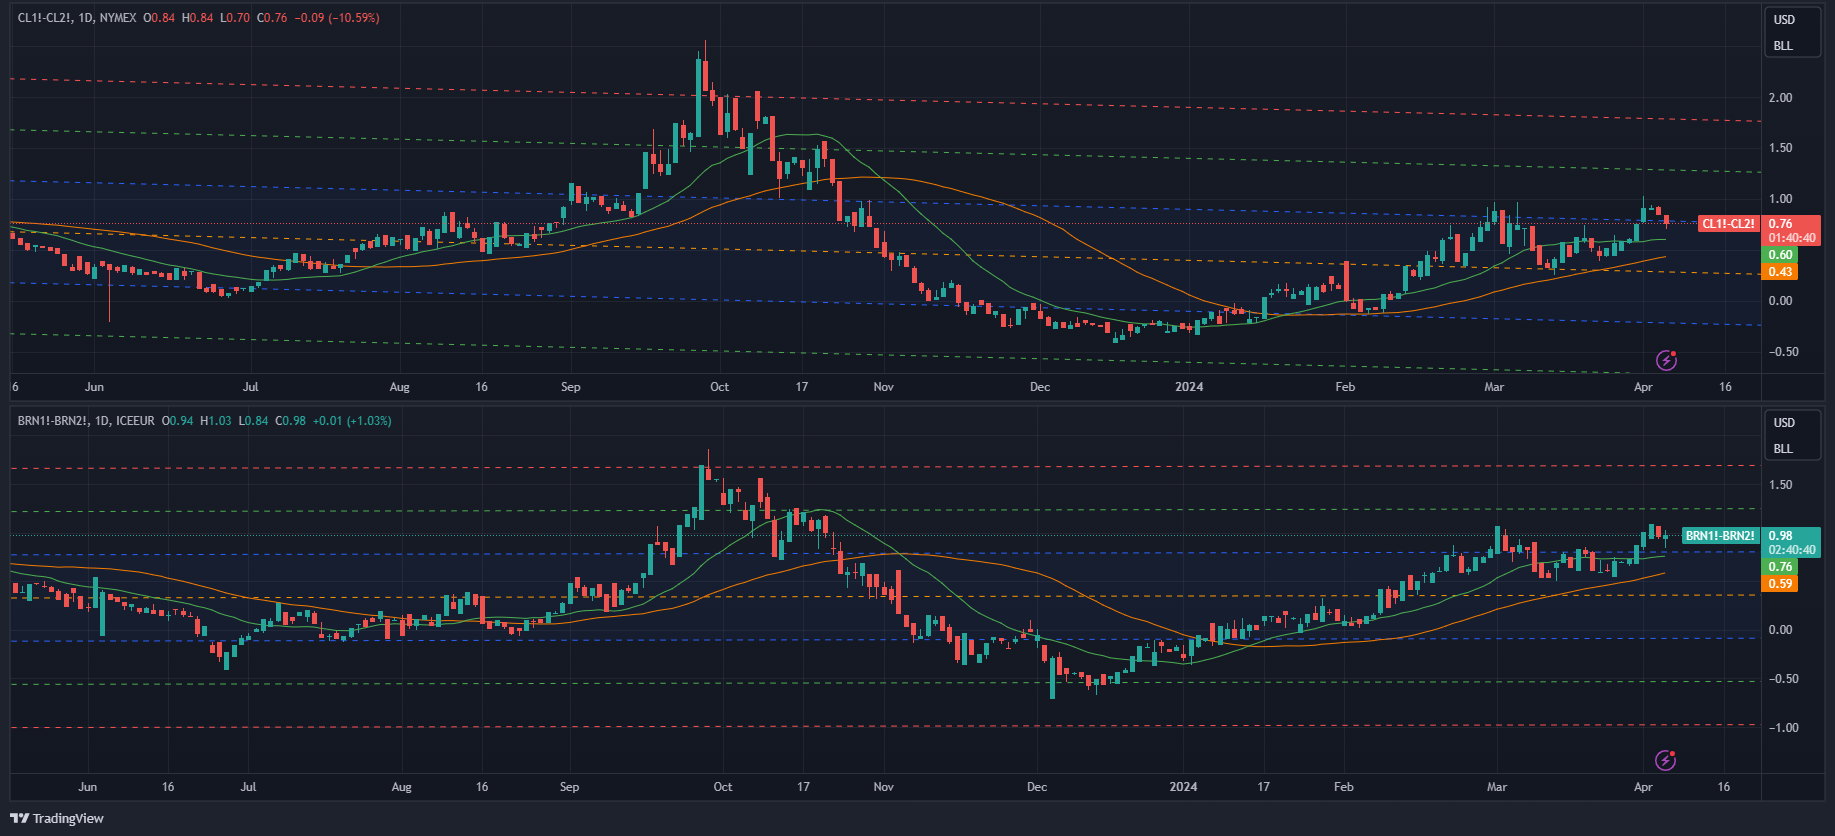
Enter the carry/momentum dashboard as the final piece of the puzzle. The two stacked charts below show the continuous prompt spreads for WTI and Brent. 25d & 50d SMA trends are plotted to track the momentum of the spreads with buy signals driven by a positive cross in the 25d over the 50d with further confirmation of the move when moving from contango into backwardation. The 250d standard deviation channels are overlayed onto the two graphs. This is an attempt to understand the normalized reaction function of CTAs and the timing of price inflection points, given when contango/backwardation is too strong most of the buying or selling has already occurred. The reaction function itself applies to the positioning of the trade, assisting in avoiding the pitfalls of a basic momentum/carry trade in buying the highs and selling the lows.
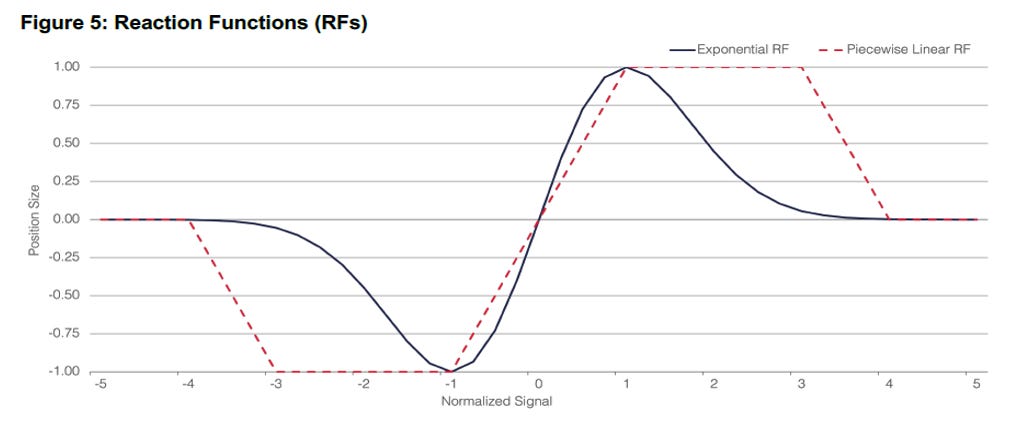
Tracking this helps determine the signal transformation points. With momentum indicators supportive and the backwardation present in the Brent and WTI prompt spreads, a move to the top line (+3 sigma) is my current target (below). After the signal point is hit, following a confirmation period, a trigger for CTAs and other market participants will likely be hit for long positions to be gradually reduced. Selling then commences and momentum flips the other way for futures spreads and flat prices until we hit the signal transformation point at the low end.
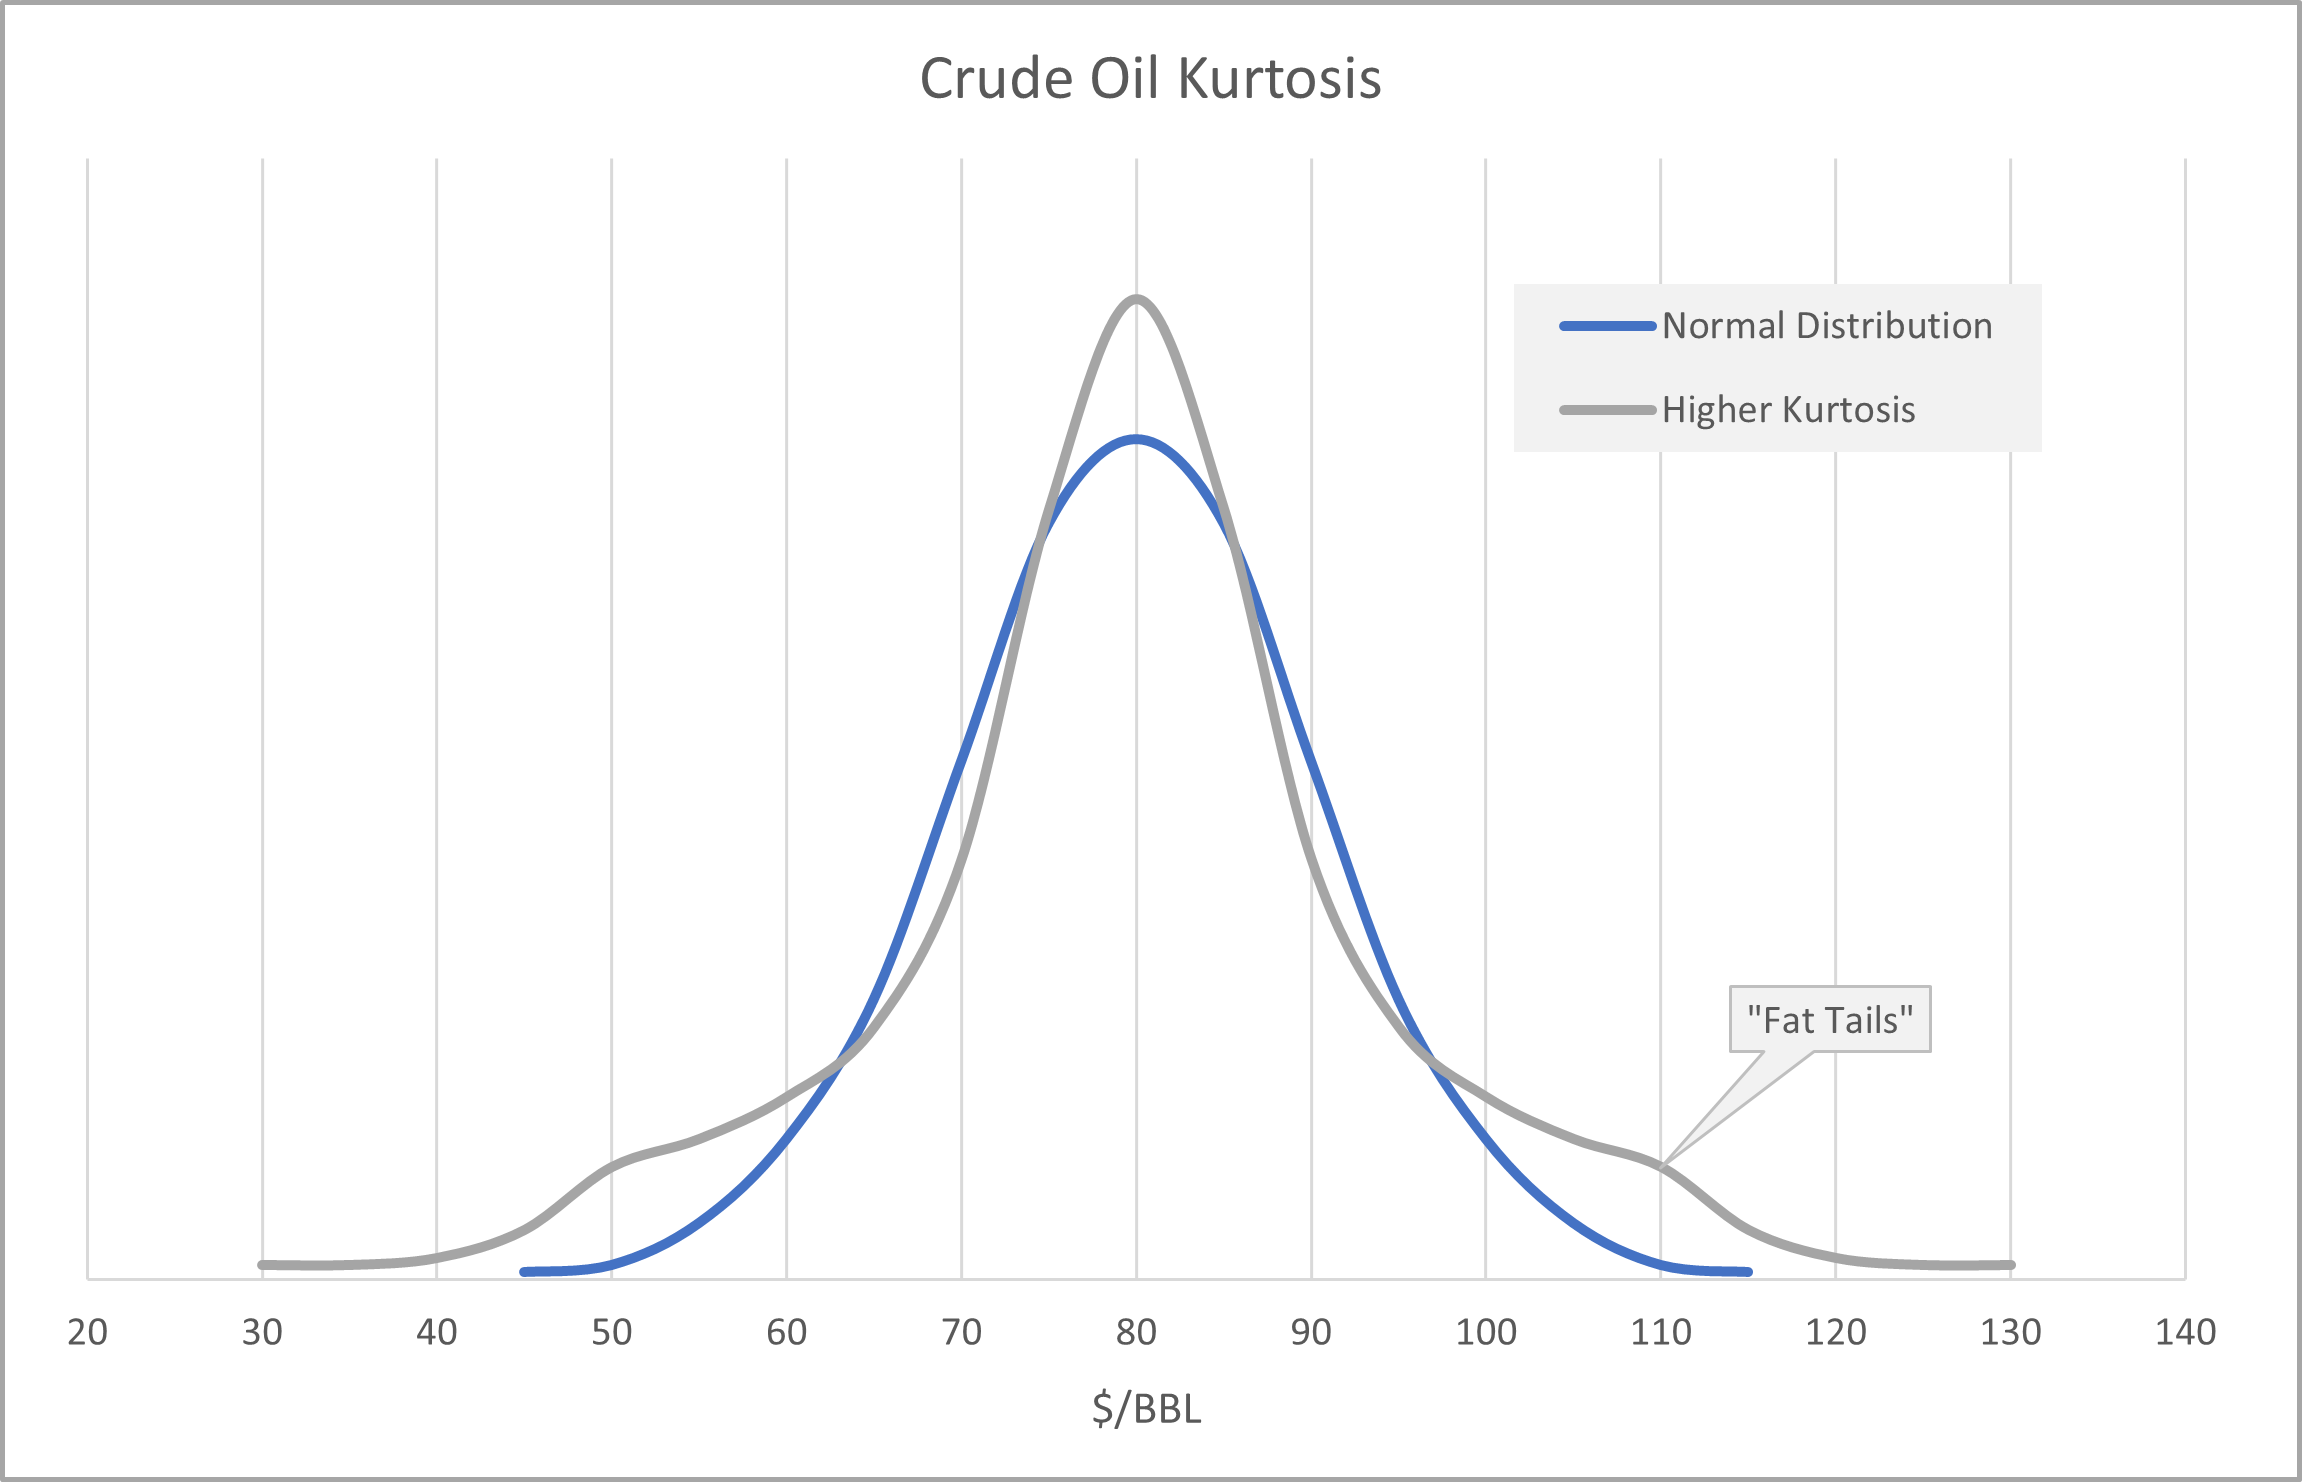
It’s worth noting with the recent geopolitical events and tensions on the rise (and specifically this weekend) my theme previously discussed around higher kurtosis in the market is firmly in play. The 2-3 sigma moves in the flat price we’ve seen should be expected and planned for in market positioning/hedging strategy. Especially given the prevalence of options traders and the managed exposure by options dealers who have to buy futures in a rising market. This typically exacerbates moves to the upside (or downside) with geopolitics currently adding fuel to the fire. But, once a signal is given to buy or sell it is usually a drawn-out process over several months to get the momentum and speculative buying or selling to turn the other way again.
As a reminder, I will continue to hold a core position of O&G equities with proven top quartile ROCE, capital efficiency, and reserve length as I believe these are the companies that will be the most successful in generating returns for shareholders over the next decade. The timing of inflection points and trades discussed above are intended to hedge my long O&G equity exposer and I would purchase 5-10% of my portfolio value in puts or put spreads depending on how high crude prices climb. For now, I’ll watch what happens as the inverse of all the paper selling we saw last year plays out into the second half of the year which seasonally brings +1Mbpd in physical demand.
Systematic Trading Signals are Live….Here’s to nailing the trade this time….
Cheers!