Houston, We Have Liftoff!

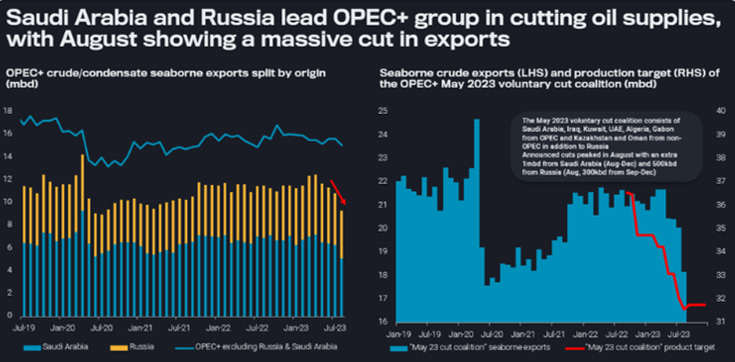
Always nice to have a surprise extension of KSA’s unilateral cuts (joined by Russia) through the end of the year as we close out the summer. I can’t say myself, or others, paying attention to Saudi’s announcements over the last several months were necessarily surprised though… Saudi Arabia, Russia extend voluntary oil cuts to year-end, markets jump
In in my last article (link below) it was was suggested that OPEC+ delivering on their cuts would be the key driver of crude prices in the near term.
First, to follow up on the proverbial elephant in the room, the OPEC+ cuts. The belief that OPEC was suffering a crisis of confidence from the markets appears to be playing out. The market clearly remains in a “Show Me” mode, and fortunately it is seeing what it needs to see to move crude prices higher.
The events of the past week prove that KSA is taking their role very seriously, even as WTI crude prices approach $90/bbl, in showing the market what it needs to see.

So, where does that leave us? What is the path of least resistance for price? How can we think about positioning ourselves accordingly as we head towards Q4? Let’s run through the charts - mostly updates from the last article, with some new ones to drive home broader themes.
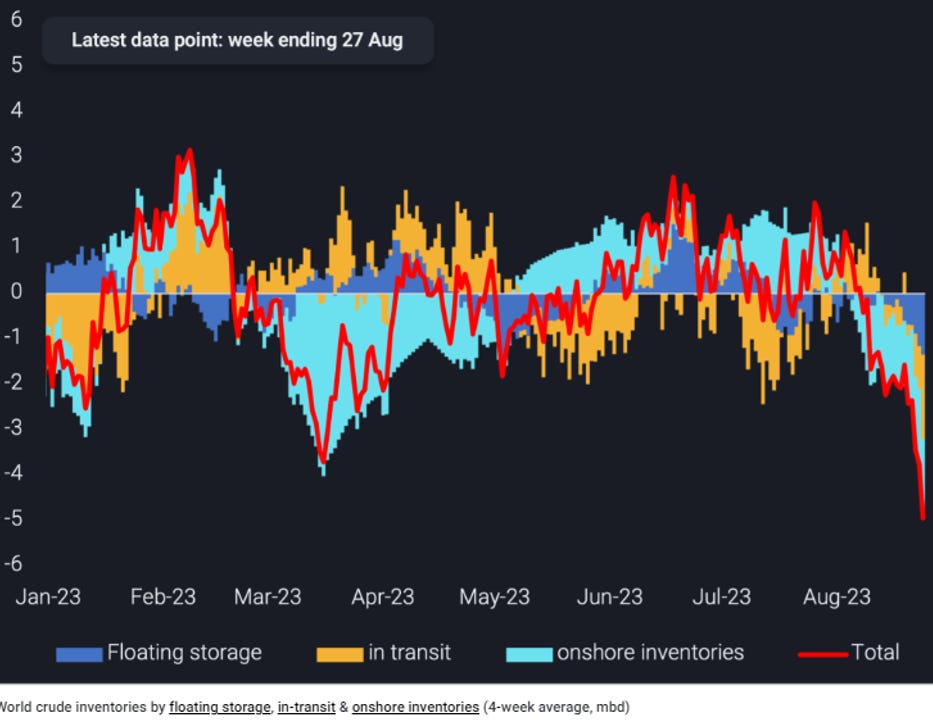
First, taking a look at global inventories and crude flows over the last several week. Vortexa recently showed a massive +4 million bpd draw on a 4 wk average basis. High frequency data sources are subject to frequent revisions but in this instance Vortexa’s data was corroborated by other data sources, including Kpler, who is currently showing a 2Mbpd deficit globally for September. (https://twitter.com/Kpler/status/1699034629909442928?s=20)
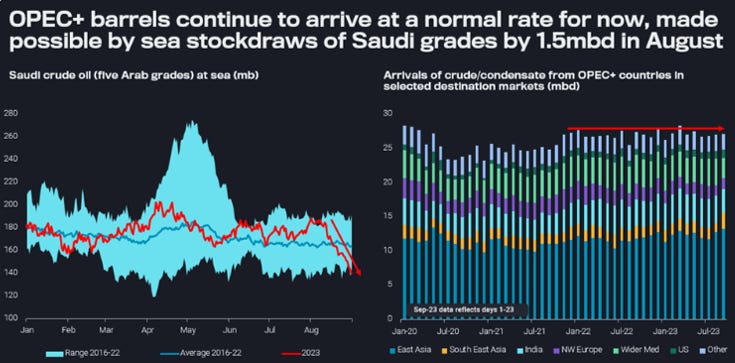
These reports set off a lot of alarms for barrel counters with scale of these draws finally beginning to show the extent of the OPEC+ cuts. Its important to remember that most of the impacts of KSA and Russia unilateral cuts have hardly been “felt” due to transit times and seaborn inventory draws. It likely will not be until the draws fully hit onshore inventory numbers that the financial market prices in the extent of the draws through the end of the year. Vortexa - Full impact of Saudi-led cuts yet to come
In the financial/paper market, changes from managed money in net positioning of WTI crude contracts continue to trend as expected after the brief consolidation period for crude prices in August (honestly a healthy pullback). The extreme short positioning by manage money through June has passed and WTI is now up 28% since our 6/28 article where this was pointed out.
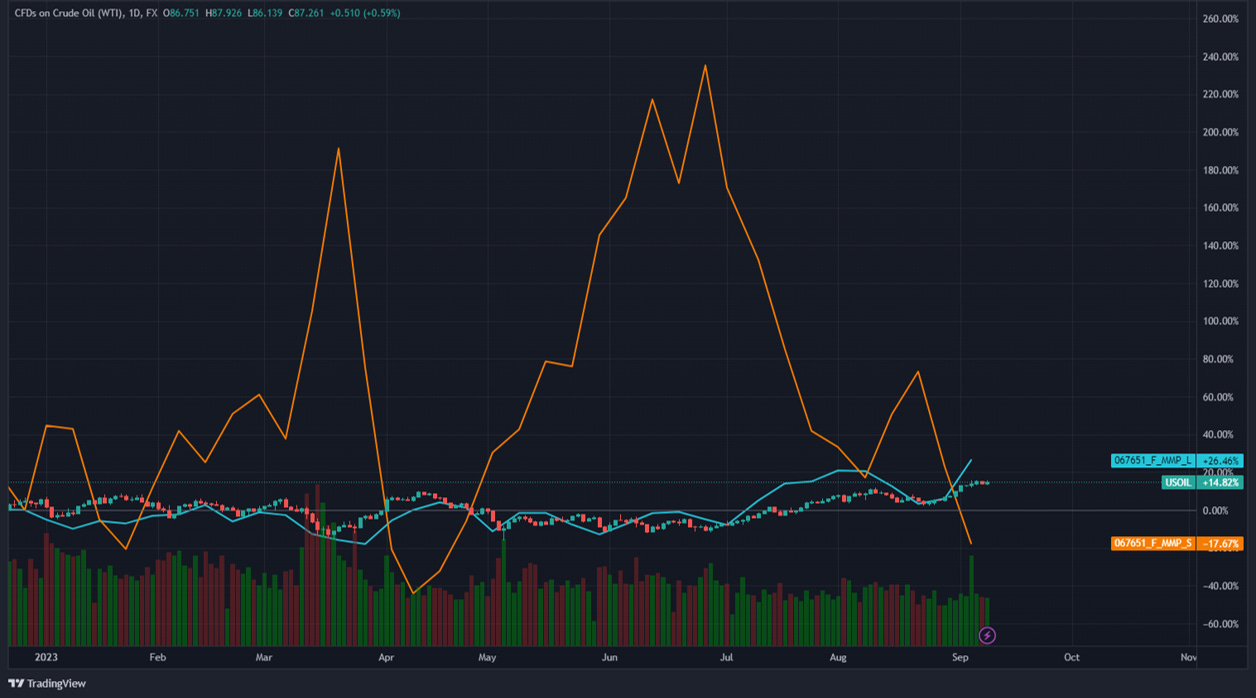
I view changes to WTI positioning as mostly played out with short positioning having normalized and longs being at their most bullish since June of last year. However, looking at the broader positioning of the market across Brent and products is a little more interesting. See below from Giovanni Staunovo (data through 8/22 shown).
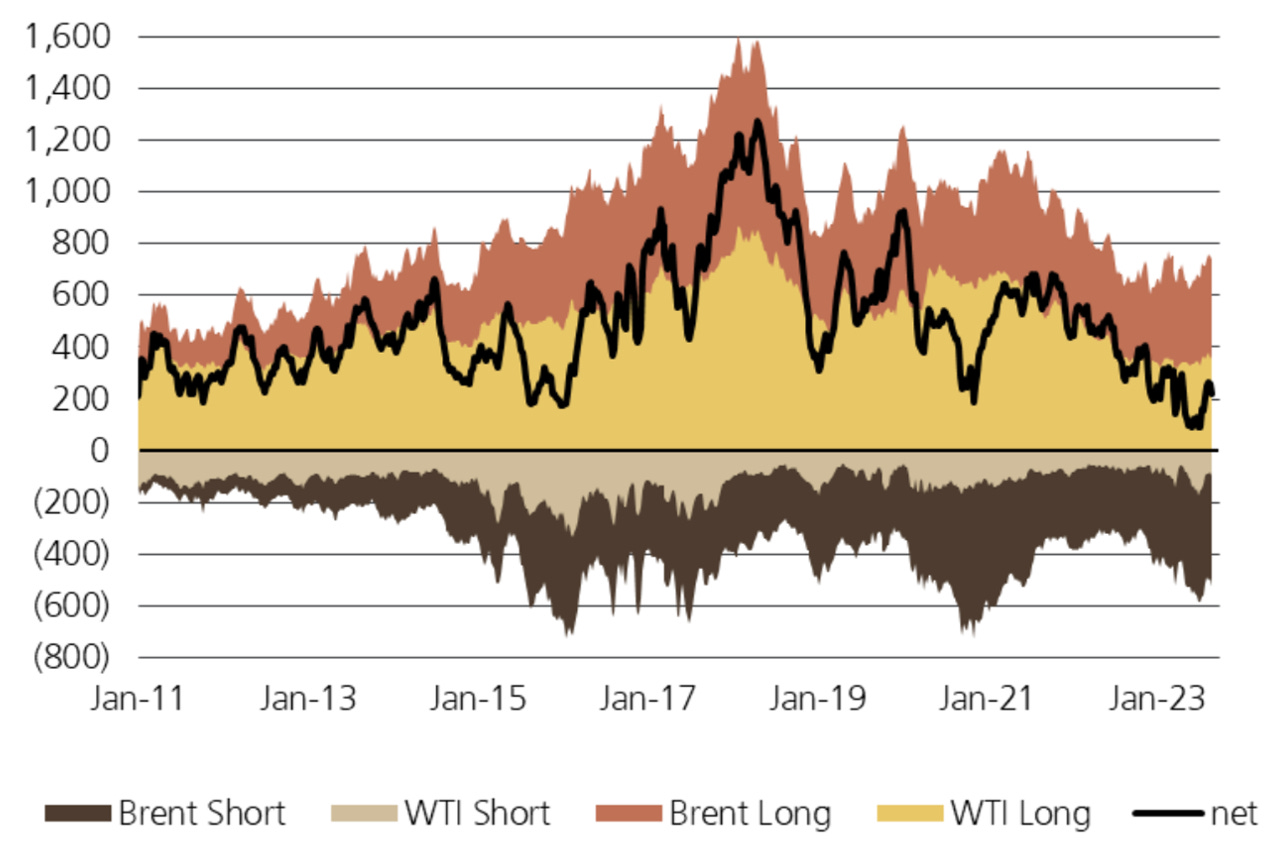
In the week following 8/22 , Brent MM reduced their net length through 8/29 – reducing long exposer while increasing short positioning. Then, with the release of positioning data on 9/8, it appears again that Brent shorts are refusing to cover with only a modest drop in short positioning as inventory draws persisted and KSA announced their intention to maintain the voluntary cut through year end. If we see another quick leg higher from here, I believe this will be the Brent short holdouts finally capitulating.
Overall crude OI (open interest) is at a healthy level and substantially higher than late 2022, providing needed market liquidity. Net-length MM positioning did increase substantially the past week across Brent/WTI futures and options as WTI shorts continued to run for the exit while longs loaded up. My view is net-length doesn’t look stretched (yet), though when looking at historical levels it important to consider the impacts of higher interests/risk free rate on OI/net positioning.
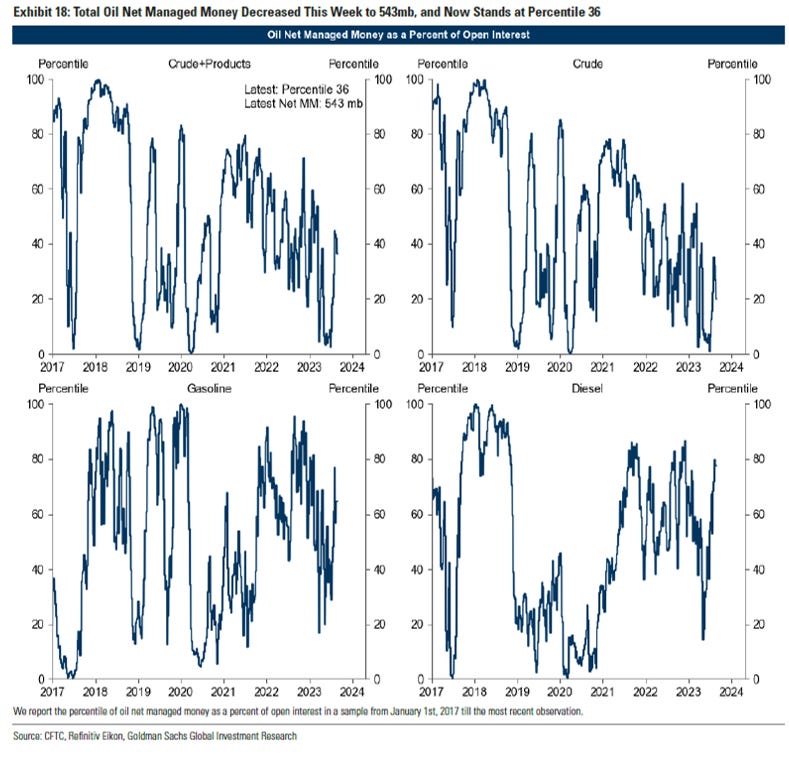
Below is a great graphic from Goldman Sach’s showing net length positioning across crude and products as a percent of OI. This is a fantastic way to view which segments of the market may be over/under bought. While the extreme long positioning in the products market is certainly justified for now, I wonder if there is some potential for unwinding of the long products trade, as we exit refinery maintenance season, to free up some allocation from a VaR perspective to roll into crude.
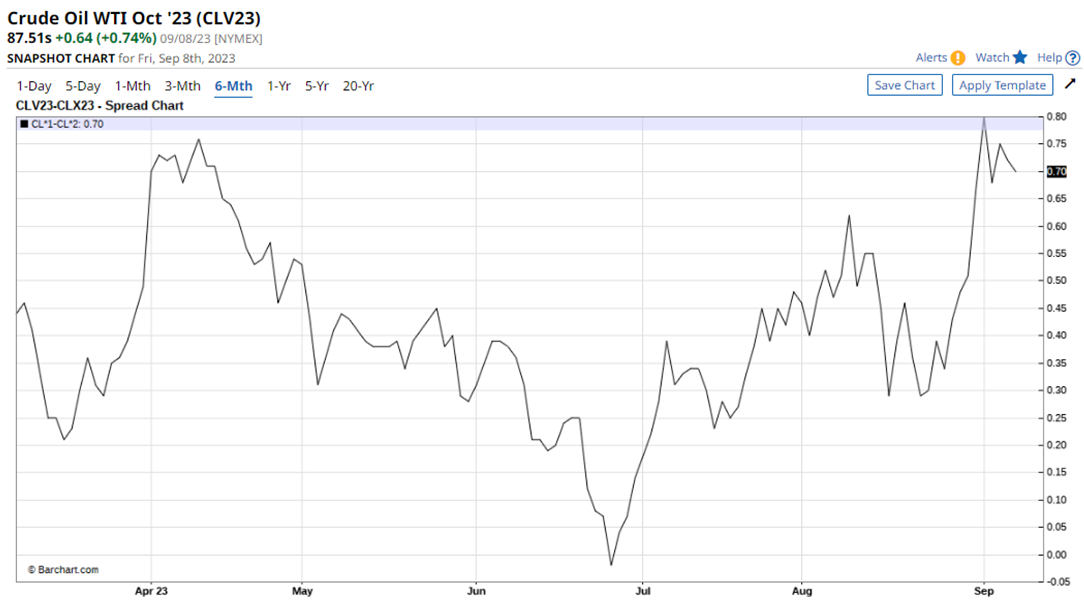
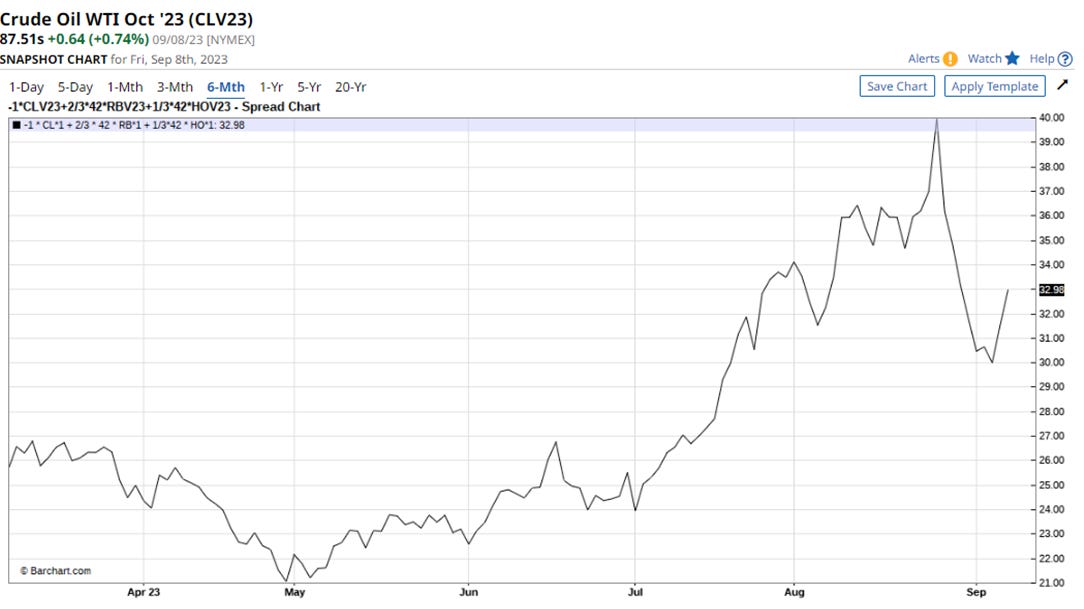
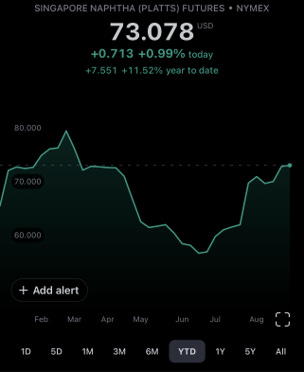
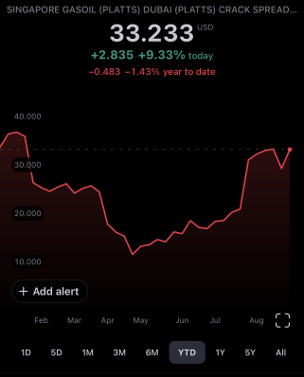
Beyond the crude paper market positioning moves, futures spreads, crack spreads, and product prices have all continued to signal the move higher as been justified by tight supplies and/or stronger demand impulses. Prompt Futures Spreads remain firmly in backwardation. US 3-2-1 Crack Spreads continued to show strength through August, with gasoline and diesel price increases outpacing crudes. With crack spreads ripping higher before the end of August, I’ve actually been happy to see a pullback when considering potential consumer led demand moderation as crude prices head higher. Looking into the Asian market, Singapore Gasoil Crack Spreads and Naphtha Futures continue to rally higher after bottoming in May and June.

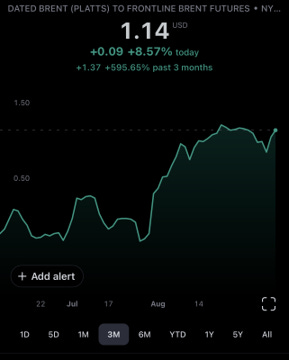
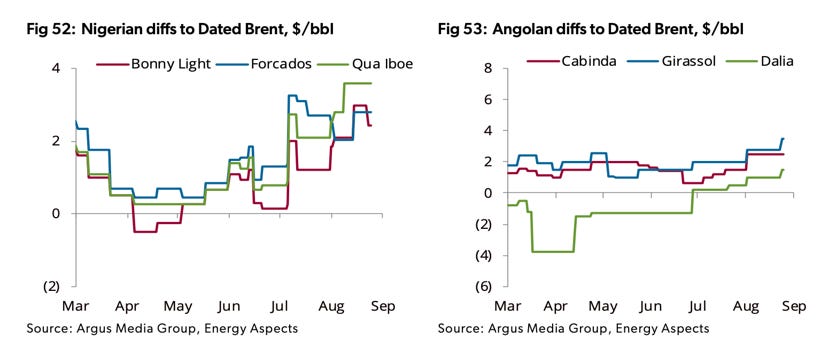
Additionally, when looking at specific physical indicators the market continues to show strength with Brent dated to frontline spread exceeding $1/bbl and WAF spreads pushing higher over the last month. Both of these indicators inflecting higher over the past moth was a powerful signal to the market that the impacts of Saudi led cuts and OSP raises were beginning to be felt/having their intended effect.
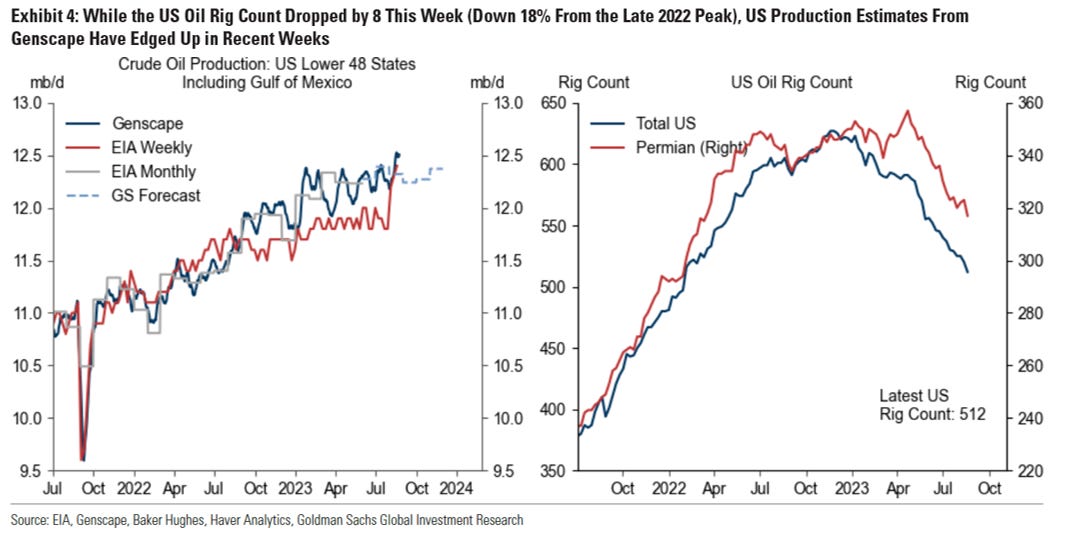
While all the above certainly continues to paint a bullish picture headed into year end, it is important to contextualize them because many of the factors are ultimately being driven by OPEC+/KSA led cuts. But, there is a reason KSA believes they can move the market in this way. Shale is no longer able to fill the gap. With total US rig count peaking in Oct ‘22 and the Permian Basin rig count peaking in ~May ‘23, the lag between production and the rig count of ~9 months (conservatively) means total US production likely peaked this summer. Though, the impact of steep drop off in rig count (see below) on production in the form of declines will likely not be seen until late Q4 as completions keep production relatively stable and due to the fact that the rig count of the major growth engine (the Permian) peaked much later. Production data confirmation from EIA PSM will not arrive not until early 2024, which will also provide a lot of information on the growth prospects of US production for the next few years as productivity data is analyzed. I believe headed into 2024 the rig count will likely reverse higher (especially with prices +$85/bbl), but ultimately we are looking at a period of US production growth moderation. KSA is fully aware of this and will press their advantage as the major marginal supplier of potential additional barrels to the market as long as they can.
Moving on to the technical side of the market, some fairly big signals have hit the price tape in the past two weeks. For reference, in my last article on 7/15 I said the following:
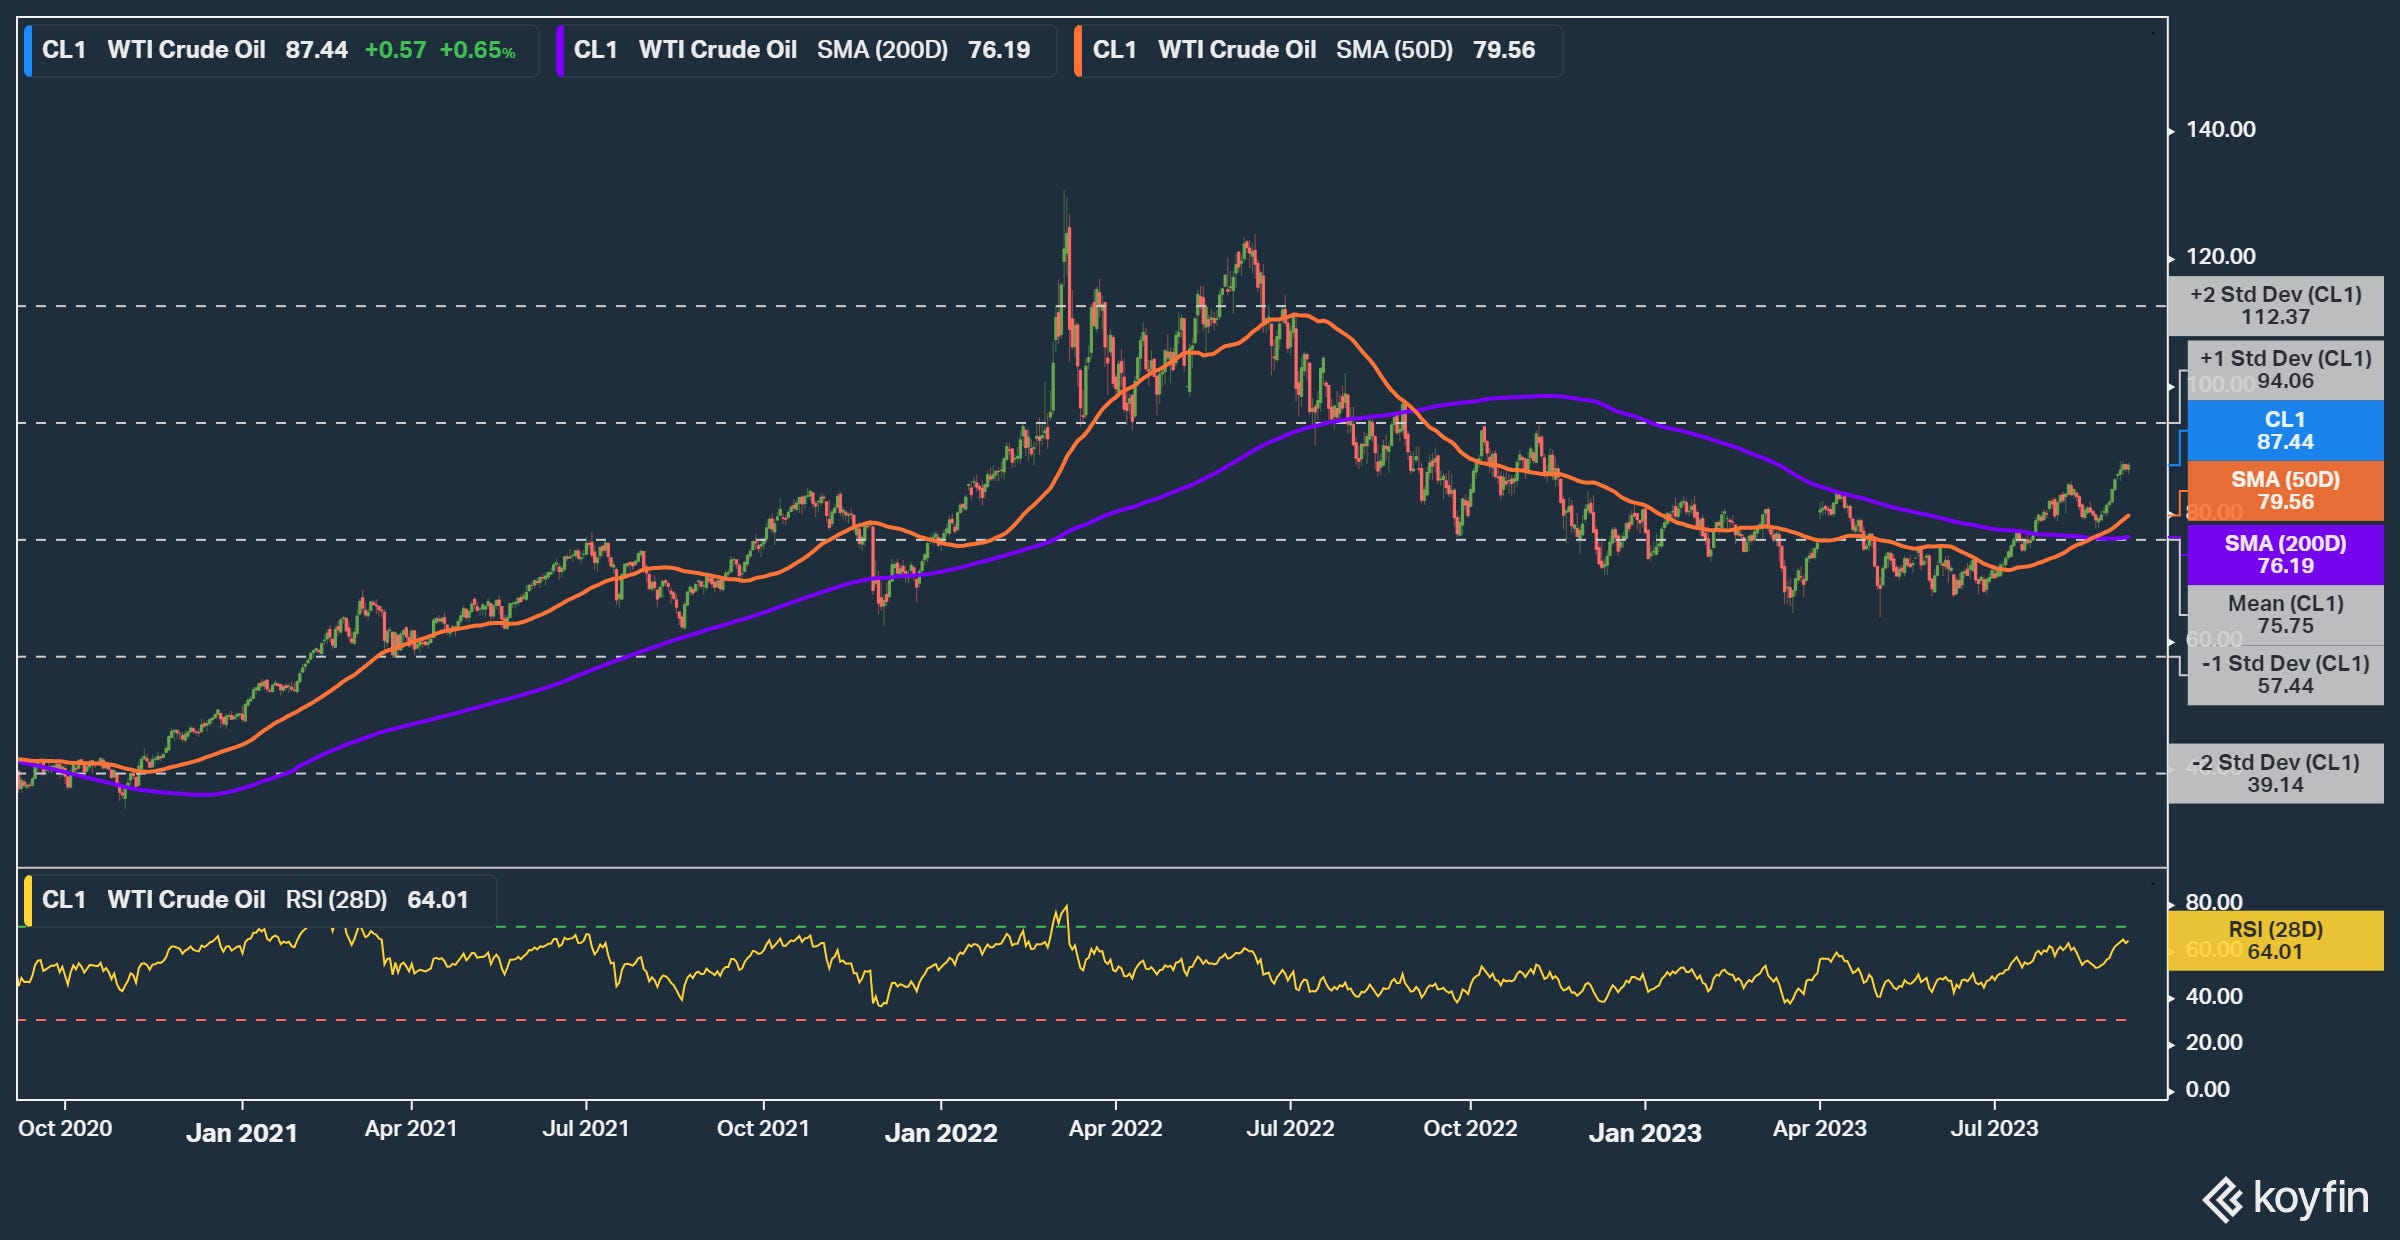
Crude price closing above the 200 day moving average is a trigger point many technical trader have been looking for since the breakdown last year. If it holds and we see the 50dMA cross above the 200dMA (Golden Cross), I believe we will likely see a move up to the +1 Std Dev line based on the 3 yr chart (update shown below).
Officially, the Golden Cross occurred on 8/22 with the 200dMA bottoming on 8/28, providing another inflection point signal for the market. The +1 Std Dev line has shifted up to $94.06/bbl and remains my next target (see graph below).
Finally, I believe the following from my previous article still holds true:
With the technical signal in place, the coming onshore inventory draws over the next several weeks should provide the fundamental basis for crude prices to move higher with money managers exiting their short positions helping the move gain momentum. However, I would hesitate to call for a +2 Std move as we will likely see some form of Chinese inventory usage (commercial/SPR) to combat prices rising higher than ~$90-$95/bbl WTI. At the same time, it seems unlikely we would get a knee jerk unwinding of any OPEC cuts (voluntary or mandated) as the group/KSA would likely take a wait and see approach with current marco economic uncertainty. This may allow for a window of stabilization in oil prices at a higher level as KSA is likely looking to over tighten and month ahead production guidance will already be set. All this sets up what could be a big move in energy equities as well. With equity flows of the past year looking like the below, I see significant upside for O&G stock over the next few months as fund flows start to adjust based on the new energy sector momentum as crude prices head higher.
The one caveat my be that KSAs resolve is more clear than ever, so +$100/bbl does appear to be more in play by end of year than I previously thought. However, it is worth considering that fall refinery maintenance/turnaround season and Chinese ability to work down some of their inventory could provide a theoretical upper bound/downward pressure on crude prices over the next two months. Therefore, I believe we see another consolidation period in the near term around $90-$95/bbl WTI, unless speculators start pile in, run away with trade and take prices as high as they want.
So, with that being said, determining if crude prices are “running away” is key and the truth to this may rest in the futures…
Consider the following graph:
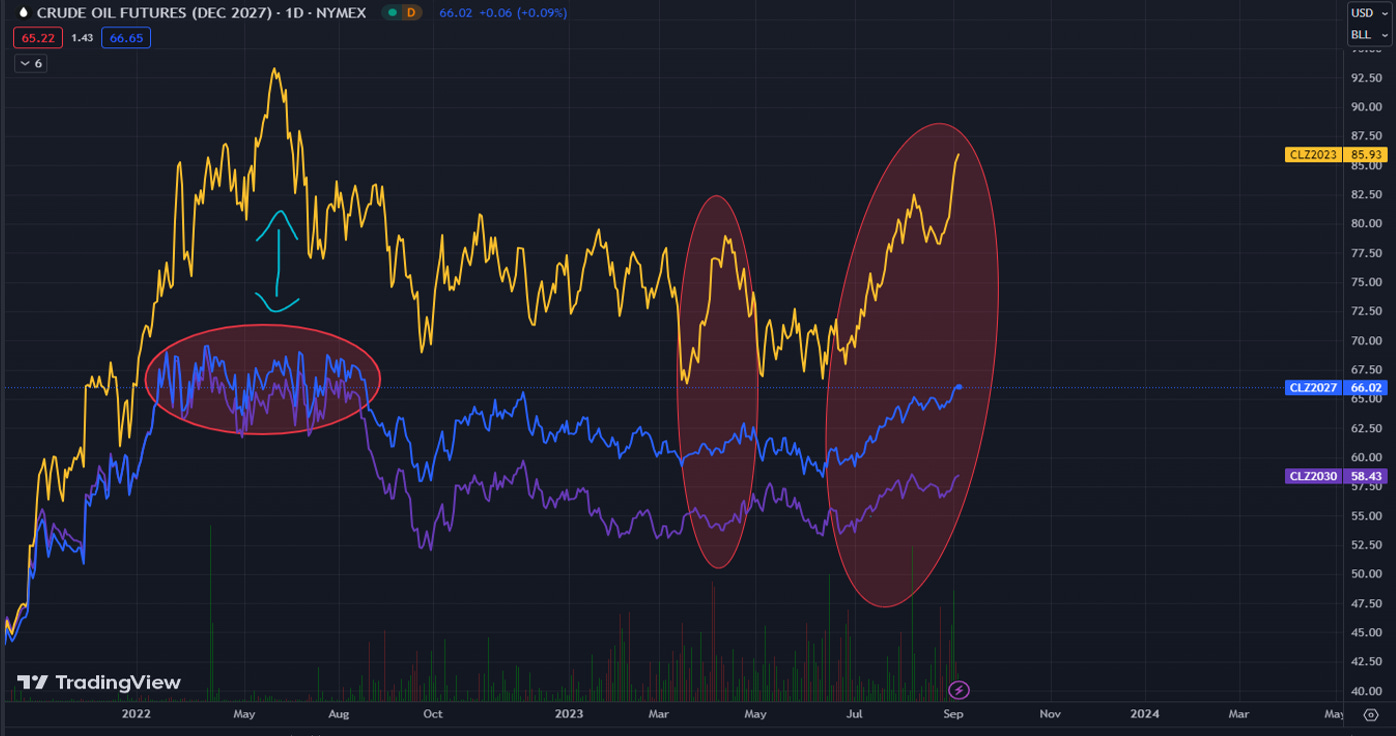
The rally in the back end of the crude price curve (Dec ‘27 & ’30 shown) in sync with near month prices (Dec ‘23) is very encouraging compared to the decoupling and lack of participation in the Mar/Apr ‘23 and ‘22 spike. Ultimately, a fundamental shift in the cost curve will be reflected in long dated futures and translate to higher equity prices. So, while I will continue to hold the best FCF generating companies for this very reason, as crude prices continue to inflect higher another trade may present itself for consideration.
This trade is predicated on the current momentum of crude prices headed into year end and given the following developments from the US crude oil ETF: USO, the largest oil ETF, restructures its investment strategy This restructuring involves shifting back to front month weighted positioning vs. a more even distribution across several months of the futures curve and will introduce more volatility into the ETF. While the fund is benefitting from significant positive roll yield currently, due to the backwardation of the futures curve, this could unwind quickly should traders run away with crude prices (+$100/bbl) and then quickly close out positions headed into 2024 given persistent lackluster global macro views.
The scenario of a prices ripping higher would set up a preferential hedge/trade in buying USO puts/put spreads if the near month futures continue their assent without long dated participation (similar to last year). Additionally, the impacts of Rho on option prices helps this trade by making puts cheaper on a relative basis due to the current interest rate environment.
I will be keeping a close eye on the long dated futures as a signal crude prices may be running away or to confirm this rally has staying power. Currently, I am considering using this trade to hedge my long O&G equity exposer and I would purchase 5-10% of my portfolio value in puts or put spreads depending on how high crude prices climb into year end.
For now, I am happy to see how the market develops over the next month and will follow up on the above in October.
Cheers!
*I am not a financial advisor and the above article should not be taken as investment advice. As always, DYODD
RySci’s Hot Sauce of the Week - Yellowbird Classic Habanero Hot Sauce